


Olifant Digital Research
Amazon advertising benchmarks and research from the brands we manage
Home of the Olifant Digital Amazon Advertising Benchmarks, plus our Google and Meta Ads studies. Built from the accounts we run every day, anonymized so no client can be identified.
Last updated November 2026 · Research led by Alex Stoykov, Founder and CEO
Flagship studies
Two benchmarks, one for each channel
Where your Amazon ads and your Google and Meta ads stand against the accounts we manage.
Amazon advertising benchmarks 2026
CTR, conversion rate, CPC and ACoS, broken down by region, match type and placement.
Google Ads benchmarks 2026
ROAS, CPC and conversion rate for both campaign types in the ecommerce Google Ads accounts we manage.
Amazon PPC studies
What the Amazon ad data says
Each study answers one question every brand owner asks, with the numbers from our managed accounts.
Amazon Top of Search vs product pages: placement benchmarks from 50 ad accounts
Conversion rate, ACoS and CPC by ad placement across 50 ad accounts.
Read the study
Do long-tail keywords convert better on Amazon? Search term data from 58 ad accounts
Conversion rate, ACoS and CPC by search term length across 58 ad accounts.
Read the study
Broad vs phrase vs exact match
Phrase match ran a 28.8% median ACoS, against 41.7% for exact and 40.0% for broad.
Read the study
Auto vs manual campaigns
Product targeting converted 12.9% of clicks and auto 5.9%, yet auto beat manual keywords on ACoS in 59% of accounts.
Read the study
Sponsored Products vs Sponsored Brands vs Sponsored Display
Sponsored Products took 85% of ad spend in the median account, and 87% of Sponsored Brands sales were new-to-brand.
Read the study
How many keywords should an Amazon ad group have?
The median keyword ad group ran 2 active keywords, and 90% had 15 or fewer.
Read the study
Which Amazon searches actually sell
86% of converting searches in the median account were not set up as exact match keywords, and they brought 65% of keyword sales.
Read the study
Where Amazon ad budgets leak
The median account spent 4.8% of its budget on search terms with 10 or more clicks and no sale.
Read the study
Top of search vs product pages
Top of search converted at 13.1% with a 26% ACoS, product pages at 5.5% with a 39% ACoS.
Read the study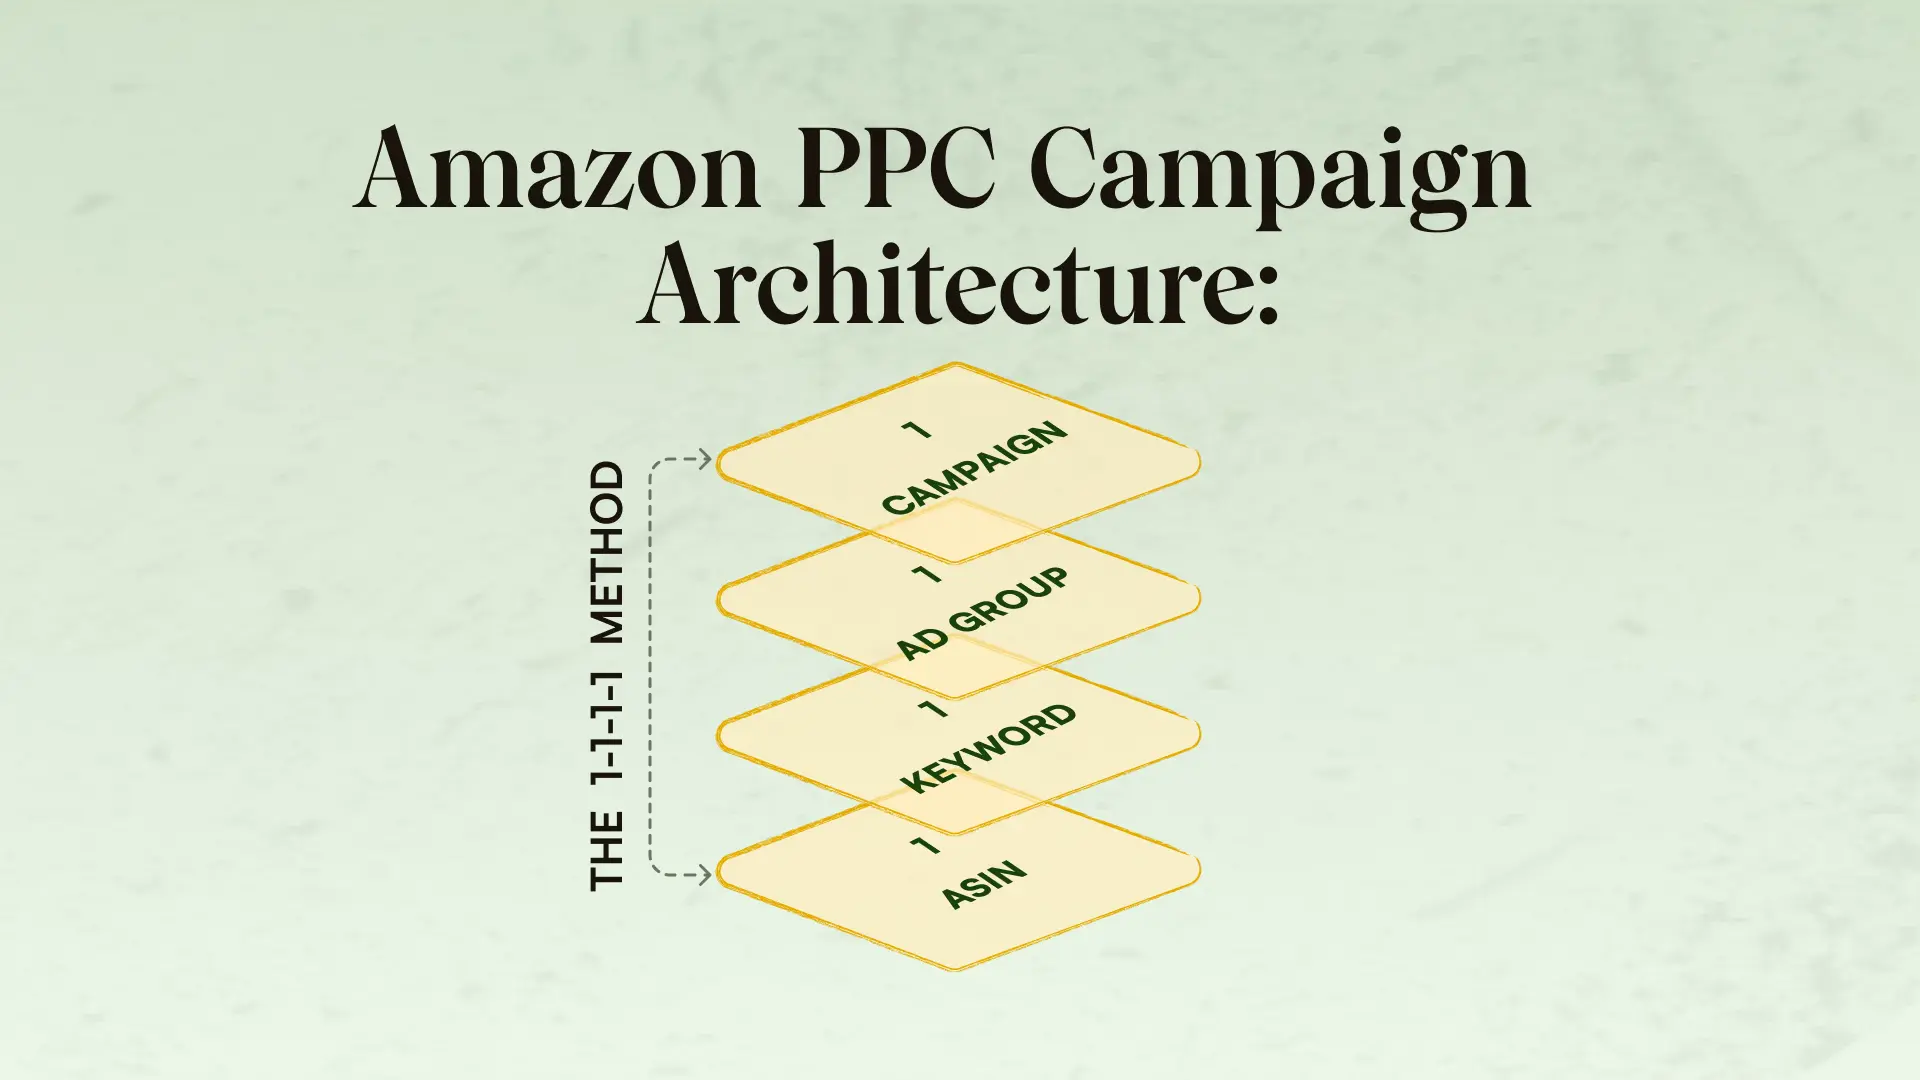
How campaign structure changes ACoS
In the median account, the best quarter of campaigns ran at 24% ACoS or lower and the worst quarter at 65% or higher.
Read the study
How many clicks a search term needs before it sells
37% of terms with 10 to 19 clicks had no sale yet, against only 9% of terms with 30 to 49 clicks.
Read the study
When to negate a search term
The median account needed about 13 clicks per sale, so a term at roughly twice that with no order is a candidate.
Read the study
Do long-tail searches convert better?
2-word and 5+ word search terms converted at about the same rate, around 8%.
Read the study
Amazon conversion rate by category
The median account converted 8.05% of ad clicks, with supplements and grocery near 12% and home and furniture near 2%.
Read the studyOff-Amazon research
What the Google, Meta and Shopify data says
Studies and playbooks from the DTC brands we manage on their own website.
How many creatives should you test on Facebook ads? What our ecommerce ad data shows
One year of ad-level data on new ads per month, ROAS, ad age and spend concentration.
Read the study
Google Ads benchmarks for ecommerce brands (2026)
Performance Max returned a median 2.50 ROAS, Standard Shopping 3.44 and non-brand Search 1.65.
Read the study
Black Friday CPM and CPC data: Meta and Google, 2024 vs 2025
Meta CPM hit 2.12x a normal October day on Black Friday 2025, while ROAS rose 2.29x.
Read the study
Best time to run Facebook ads
Ads shown from 10am to 4pm earned a median 10% more ROAS than the account average, and 6am to 10am earned 13% less.
Read the studyHow much revenue is your own brand name
36.5% of Google Ads revenue came from branded search, on just 7.3% of spend, in the median account.
Full study coming soonDoes more creative testing pay?
ROAS was 17% lower in months with more new ads than usual, in 7 of 8 accounts, while spend was about the same.
Read the study
Google Merchant Center feed fixes that move Shopping performance
The audit we run before any bid change: approved vs archived counts, split variants and hidden sale prices.
Read the guide
How to increase AOV on Shopify
Bundles, upsells and free-shipping thresholds, and how to test each one so it pays off.
Read the guide
Abandoned cart recovery for Shopify
The email, SMS and retargeting mix we use, and how to measure which channel really drives sales.
Read the guide
Amazon vs DTC: should you sell on both channels?
How to split products, pricing and ad budget when your brand sells on Amazon and its own store.
Read the guide- Meta Ads, December 2026Meta ads benchmarks for DTC brands: CPM, CTR and ROAS by month
- Amazon and Shopify, December 2026Black Friday 2026 results: Amazon vs Shopify for the same brands
Black Friday and Q4
Deals, ad costs and peak season
Amazon, Shopify and Meta: what changes in Q4 and how we plan for it.
Amazon Black Friday sales: what our brands sold in 2025
Black Friday reached 2.15x normal daily sales for the median account in 2025, and Cyber Monday 2.06x.
Read the studyBlack Friday CPM and CPC data: Meta and Google, 2024 vs 2025
Meta CPM hit 2.12x a normal October day on Black Friday 2025, while ROAS rose 2.29x.
Read the studyWhat November does to Meta costs
CPM was 30% higher in November than in the rest of the year in the median account.
Full study coming soon
5 Shopify settings that cap your Black Friday revenue
What to check in your store, when to fix it and how to test it before the sale starts.
Read the guide
How we split Q4 budget between Prime Big Deal Days and Black Friday
We fund October at 20 to 25% of Q4 budget and only move to 30% when an account passes four checks.
Read the study
Is 20% off worth it for Amazon Black Friday deals?
Run the per-product margin math first: holiday peak fees add roughly $0.32 per unit on average from October 15.
Read the study
How Amazon coupons work: fees, rules and budget math
The $5 + 2.5% fee, eligibility rules and the budget math we use before turning coupons on.
Read the studyReal accounts, real numbers
Case studies and market data
From $0 to $1M on Amazon: launching a DTC beauty brand
The catalog setup, launch sequence and PPC strategy behind the first $1M.
Read the studyThe ad strategy behind a $4M-a-year pet brand
Real TACoS, ACoS and search term numbers from a pet account doing $4M+ a year on Amazon.
Read the studyAmazon seller statistics 2026
60+ data points on marketplace size, active sellers, FBA fees, ad costs and real profit margins.
Read the studyAmazon FBA fees 2026: what changed
Per-unit increases run from about $0.05 to $0.51 depending on size, tier and price.
Read the studyMethodology
How we build our research
Real accounts
Amazon Ads, Seller Central, Meta and Google Ads data from the brands we manage in the US, UK, EU, Canada, Mexico and Australia.
Anonymized
We report medians and ranges across accounts. No client names, and nothing that identifies a brand.
Dated
Every study shows the period the data covers, so you always know how fresh the numbers are.
Free to cite
Quote any number in your own article or deck. All we ask is a link back to the study.
Writing about Amazon or ecommerce? Use our numbers with a link to the study page. For a specific data cut, email alex@olifantdigital.com.
FAQ
Quick answers from our data
What is a good ACoS on Amazon in 2026?
In September 2026, the median ACoS across the 66 Amazon ad accounts we manage was 34.2%, and 21.0% pooled across all US spend. A good ACoS depends on your margin: it should sit below your break-even ACoS.
What is the average conversion rate for Amazon ads?
The median account converted 8.05% of ad clicks in September 2026. Supplements converted at 12.0%, grocery and beverage at 11.8%, home and furniture at 2.0%.
What is the average CPC on Amazon?
$1.13 median CPC in the US accounts we manage, with a 0.66% median click-through rate (September 2026).
Does top of search convert better than product pages?
Yes. Top of search converted at 13.1% with a 26% ACoS, product pages at 5.5% with a 39% ACoS.
Source: Top of search vs product pages
How many clicks before you negate an Amazon search term?
The median account needed about 13 clicks per sale, so a term at roughly twice that with no order is a candidate to negate.
Source: When to negate a search term
Is Performance Max better than Standard Shopping?
Not on return. Across 19 ecommerce Google Ads accounts (November 2025 to October 2026), Standard Shopping returned a median 3.44 ROAS and Performance Max 2.50, even though Performance Max took 79% of spend in the median account.
How much do Amazon sales rise on Black Friday?
In 2025, Black Friday reached 2.15x normal daily sales for the median account we manage, and Cyber Monday 2.06x.
Source: Amazon Black Friday sales: what our brands sold in 2025

Want these numbers for your own account?
Answer 5 quick questions and get your free marketing plan in 24 hours:
what is wrong, what to fix first and the results you can expect.