Introduction
When you run Sponsored Products ads on Amazon, your ads don’t always appear in the same spot. They can appear in the first row of search results, further down the search page, or on another product’s detail page.
Placement performance can vary considerably within the same account. Reviewing spend, attributed orders and revenue by placement helps you identify where to test changes.
We wanted to see how big this difference really is, which is why we looked at the placement data for the brands that Olifant Digital manages.
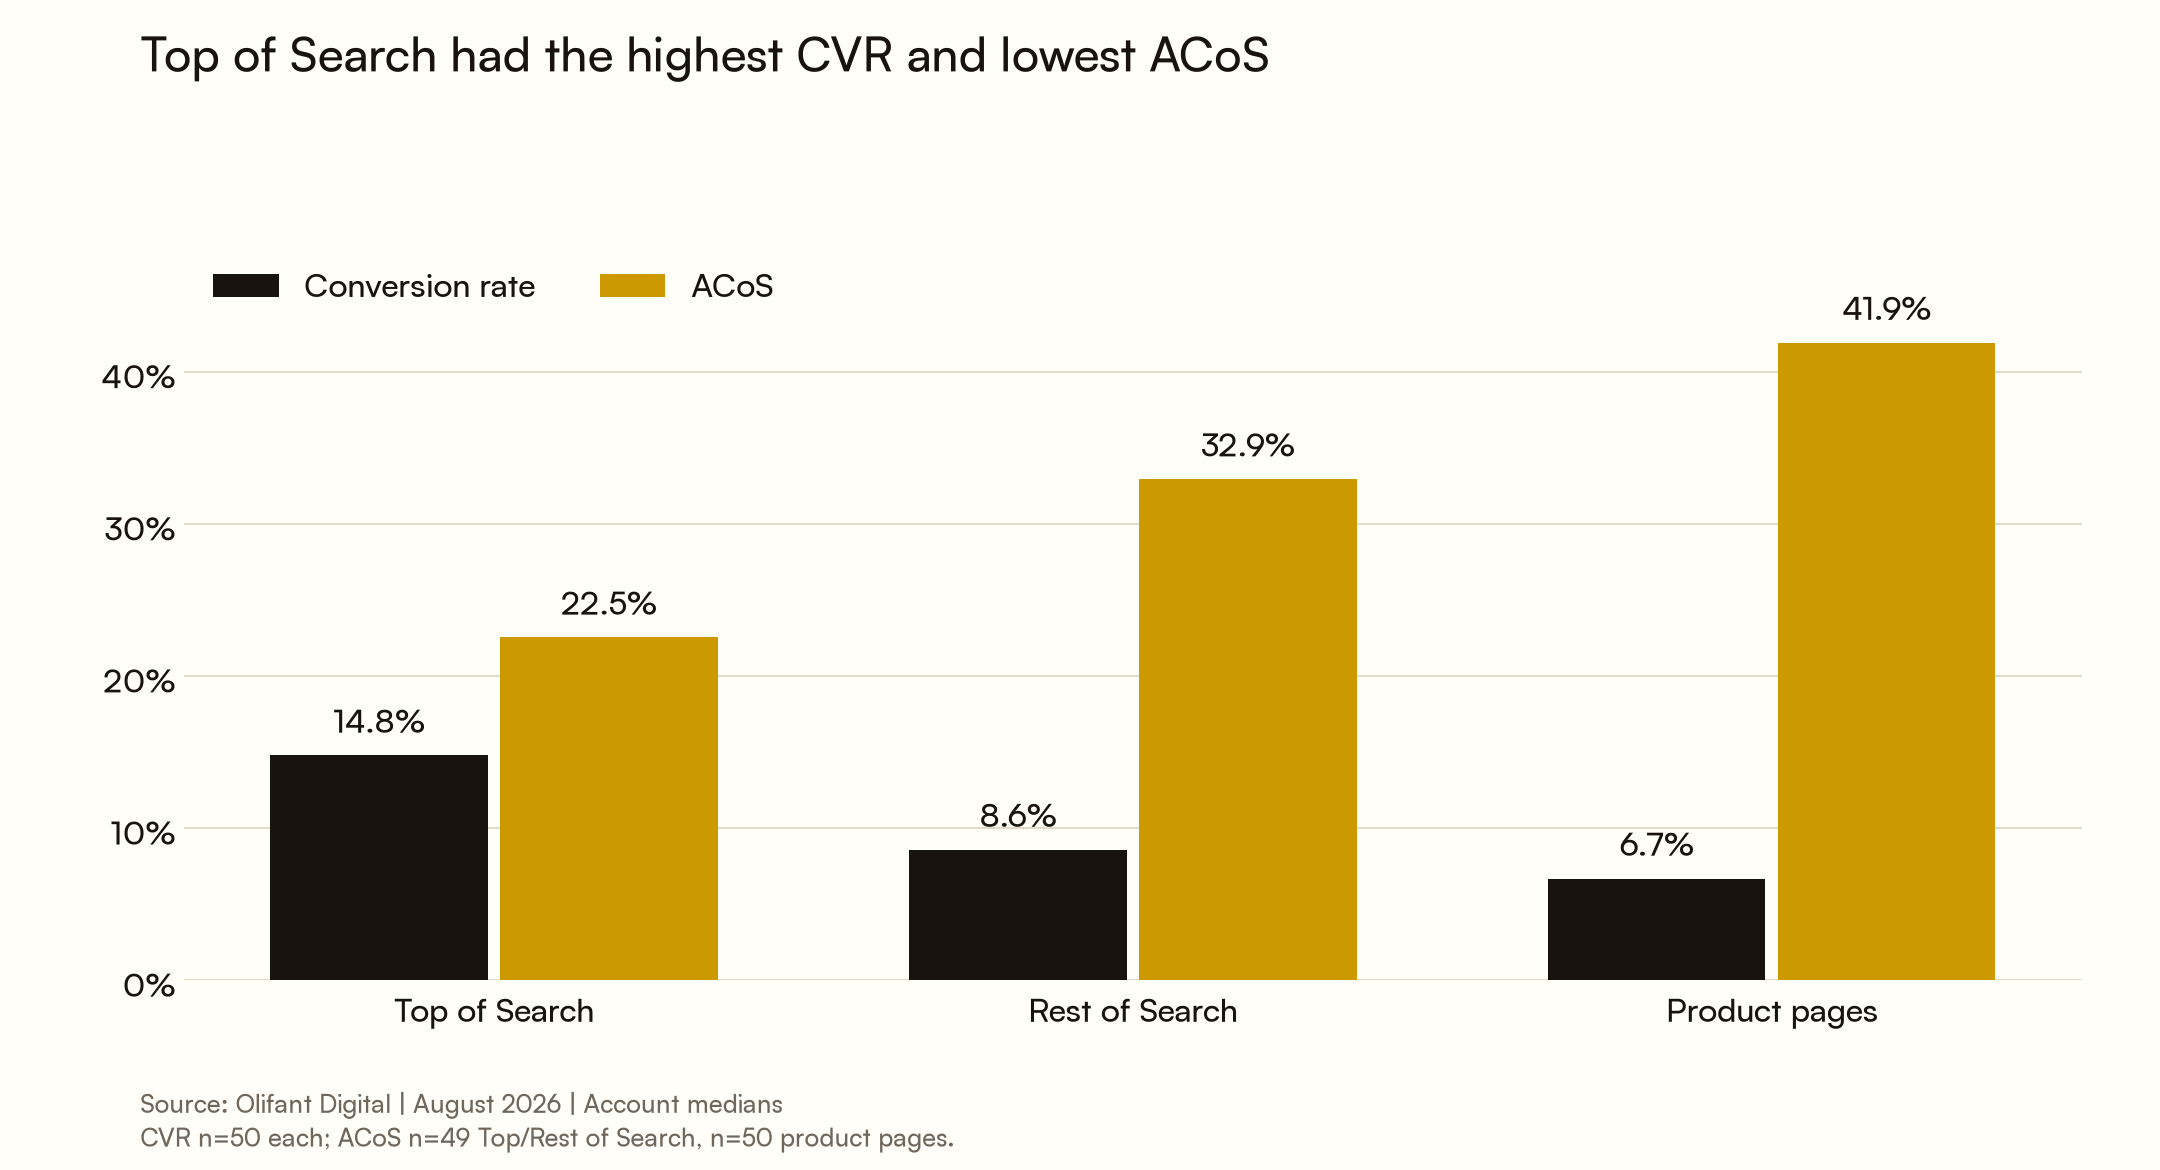
In August 2026, Top of Search converted at a median of 14.8%, compared with 6.7% on product pages. Median ACoS was 22.5% for Top of Search and 41.9% for product pages. Rest of Search and product pages together received a median 58% of Sponsored Products spend.
Top of Search showed stronger observed efficiency. The spend split alone does not show whether a different allocation would improve results.
We analysed Amazon Sponsored Products placement reports covering 50 ad accounts from 38 brands across nine marketplaces and six reporting currencies for the full month of August 2026.
A separate event view covers Prime Big Deal Days on October 6 to 7, 2026, using 18 eligible accounts. Figures are account medians, including ratios calculated within each account. The methodology below explains the sample used for each metric.
Key findings
- Top of Search had a median conversion rate of 14.8%, compared with 8.6% for Rest of Search and 6.7% for product pages, across 50 accounts.
- Top of Search had the lowest median ACoS: 22.5%, compared with 32.9% for Rest of Search and 41.9% for product pages. ACoS measures ad spend relative to attributed revenue, rather than cost per order or profit.
- Across the sample, Top of Search had a higher conversion rate than product pages in 47 of 50 accounts. It also had lower ACoS in 42 of the 49 accounts where both placements had defined ACoS.
- Within-account comparisons showed a median Top of Search CPC premium of 20% over product pages. The median conversion-rate ratio was 1.98x. Each ratio is calculated separately.
- The median combined spend share for Rest of Search and product pages was 58%. Top of Search received a median 41.3%; the individual medians for Rest of Search and product pages were 26.4% and 31.1%.
How do the three placements compare?
The main on-Amazon placements in this analysis are Top of Search, Rest of Search and product pages.
- Top of Search is the first row of results that a shopper sees after typing in a search.
- Rest of Search covers everything that is further down that page and on the pages after it.
- Product Pages are the ad slots on the detail pages of other listings.
Your placement report breaks down clicks, spend and sales for each of these three, so you can see where the money goes and what it brings back. Here is how the three placements compared in August 2026.
To be counted, an account needed at least 100 clicks in all the three placements that month.
| Metric (account medians; n varies by metric) | Top of Search | Rest of Search | Product pages |
|---|---|---|---|
| Conversion rate (orders / clicks) | 14.8% | 8.6% | 6.7% |
| ACoS | 22.5% | 32.9% | 41.9% |
| ROAS | 4.23 | 2.98 | 2.39 |
| Click-through rate | 3.95% | 0.54% | 0.26% |
| Share of Sponsored Products spend | 41.3% | 26.4% | 31.1% |
Each placement's spend share is calculated as a share of all Sponsored Products spend, including off-Amazon placements. The table omits the off-Amazon row; its median spend share was 0.6%. Each displayed share is a separate account median, so the columns do not need to sum to 100%.
Sample sizes: CVR, ROAS, CTR and spend share use 50 accounts per placement. ACoS uses 49 accounts for Top of Search, 49 for Rest of Search and 50 for product pages. ACoS is undefined when attributed sales are zero.
Top of Search had the highest median conversion rate, ROAS and CTR, and the lowest defined median ACoS in this sample.
These differences can reflect search intent, branded traffic, product mix, targeting and existing bid settings. The placement report does not isolate the contribution of each factor.
If you need a quick refresher on what ACoS and ROAS measure, our guide to ACoS meaning explains both.
Is Top of Search worth the higher cost per click?
Top of Search often combined higher click costs with stronger observed returns in this sample. To compare accounts reporting in six currencies, we calculated placement ratios within each account.
A ratio of 1.00 means the same result as product pages in that account. We then took the median ratio across eligible accounts, rather than dividing the medians in the first table.
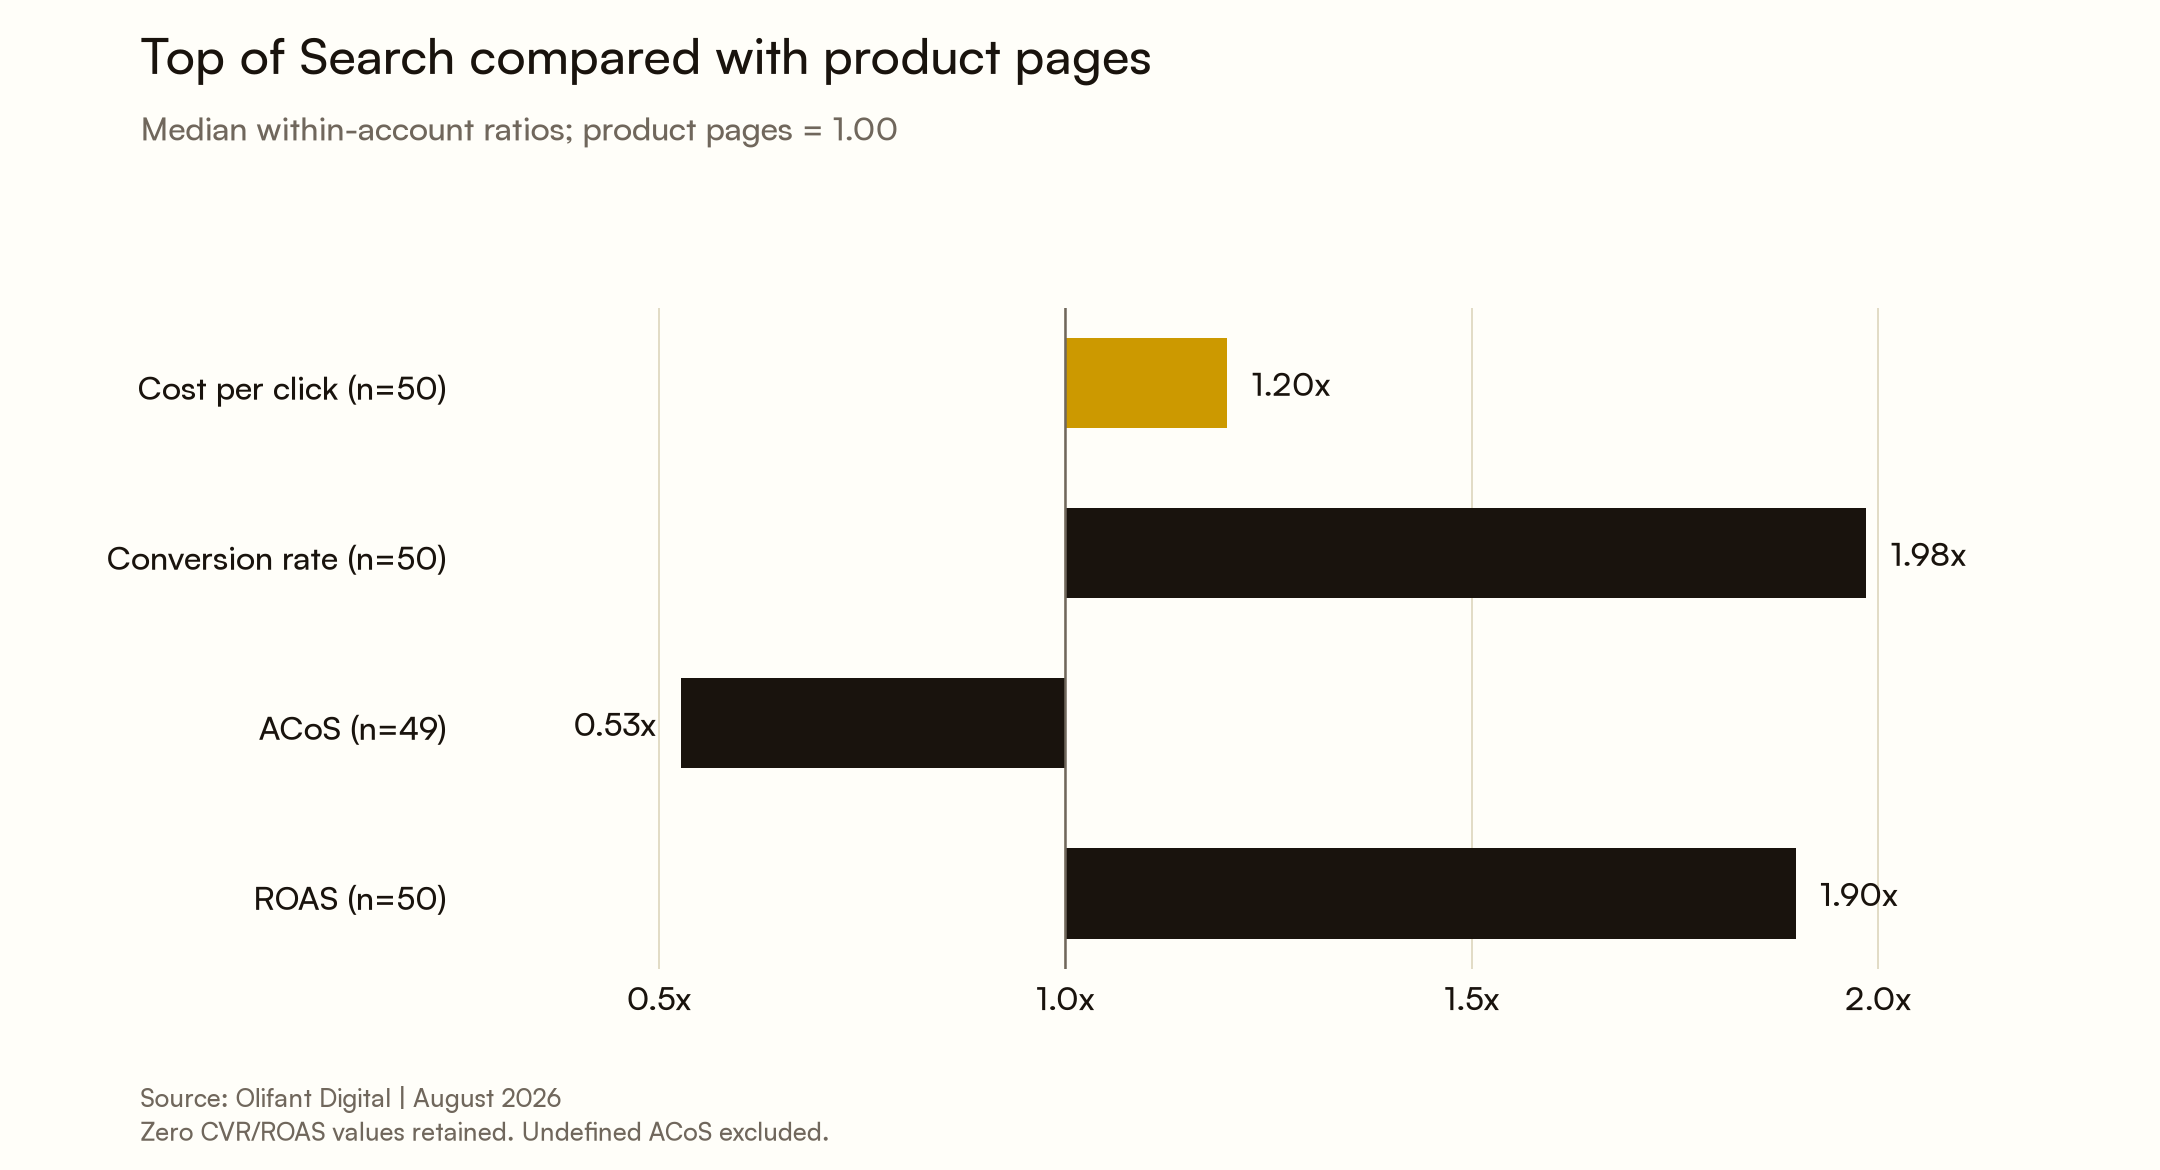
| Top of Search / product pages (median within-account ratio) | Ratio |
|---|---|
| Cost per click (n=50) | 1.20x |
| Conversion rate (n=50) | 1.98x |
| ACoS (n=49) | 0.53x |
| ROAS (n=50) | 1.90x |
The median Top of Search CPC ratio was 1.20x product pages, while its median CVR ratio was 1.98x. In 34 of 50 accounts, Top of Search clicks cost more. Among the 49 accounts with defined ACoS for both placements, Top of Search had lower ACoS in 42.
A higher CPC can still meet your target if conversion rate and revenue per order support it. Judge placement performance against your own product margins, and test changes before increasing spend substantially.
The middle half of accounts with defined Top of Search ACoS ranged from 16.1% to 36.7%. For product pages, the range was 28.7% to 74.1%. These are observed advertising-efficiency ranges, not profit thresholds.
| ACoS spread (accounts with attributed sales) | 25th percentile | Median | 75th percentile |
|---|---|---|---|
| Top of Search (n=49) | 16.1% | 22.5% | 36.7% |
| Rest of Search (n=49) | 22.3% | 32.9% | 48.4% |
| Product pages (n=50) | 28.7% | 41.9% | 74.1% |
Among the 49 accounts with defined ACoS for both placements, product-page ACoS was at least 1.5 times Top of Search ACoS in 30.
Where does the ad budget actually go?
Rest of Search and product pages together received a median 58% of spend, while Top of Search received a median 41.3%. The combined share is calculated within each account before taking its median.
Top of Search was the largest placement by spend in 27 of 50 accounts. In the other 23, Rest of Search or product pages received the largest share. That is a description of allocation, not proof of waste.
Product targeting and own-listing defence can serve different purposes from search campaigns. Available placement inventory also differs, so shifting spend may change traffic quality and click costs.
Review placement allocation alongside each campaign's purpose and product-level targets. Our post on Amazon PPC budget allocation explains how to plan that review.
What did placements show during Prime Big Deal Days?
The October 6 to 7, 2026 event view includes 18 accounts from 18 brands, each with at least 100 clicks in all three placements. Top of Search again had the highest median conversion rate and lowest median ACoS.
| Metric (median, n=18 accounts, Oct 6 to 7, 2026) | Top of Search | Rest of Search | Product pages |
|---|---|---|---|
| Conversion rate | 21.8% | 11.1% | 9.4% |
| ACoS | 20.2% | 26.5% | 30.9% |
| Share of Sponsored Products spend | 44.7% | 24.6% | 26.5% |
Within the event sample, the median Top of Search CPC ratio was 1.48x product pages, and the median ACoS ratio was 0.70x. Top of Search converted better in all 18 accounts and had lower ACoS in 16.
These 18 accounts are part of the August sample, but the August headline table uses all 50 accounts. The two views therefore do not measure event-driven uplift. If you are planning ahead for the next big sales event, you should take a look at our post on Black Friday and Cyber Monday Amazon ads.
What this means for your brand
We already have a written step-by-step guide on Amazon placement modifiers and bid rules. Use those practical steps alongside your own account's placement results.
- Pull your own placement reports first. Compare the last 30 to 60 days by campaign and product, with enough clicks and time for the 7-day attribution window to mature. Set an ACoS target from your contribution margin and business goal before changing bids.
- If Top of Search meets your target, test a modest placement-modifier increase while keeping other major settings stable. Review actual spend, attributed sales and ACoS after attribution matures. The historical ACoS gap does not tell you how much extra bid or spend the placement can absorb.
- Review base bids and placement modifiers together. A base-bid change can affect several placements, so check the resulting mix and total account performance before making another change.
- Judge product page spend by the job it does. Defensive ads on your listings and ads that target competitors can be worth running even at a higher ACoS. Separate defensive and competitor-targeting campaigns where useful, so you can assess each against its own purpose and margin target. Our post on Amazon PPC campaign architecture shows how to set these campaigns up.
- Review total sales, margin and TACoS alongside placement ACoS. This study does not measure incremental profit or changes in organic ranking. For further context, see how Amazon PPC feeds organic ranking and also in our comparison of TACoS vs ACoS.
How we collected this data
Source: We used Amazon Ads Sponsored Products campaign reports split by placement, which we pulled through the Amazon Ads API for the accounts that Olifant Digital manages. Sales and orders use Amazon’s 7-day attribution.
Period: August 1 to 31, 2026 for the main analysis; October 6 to 7, 2026 for the separate Prime Big Deal Days view.
Sample: 65 accounts had eligible August placement-report data before the click threshold. We retained the 50 with at least 100 clicks in each of Top of Search, Rest of Search and product pages. These accounts represent 38 brands across the US, Canada, Mexico, UK, France, Germany, Italy, Spain and Australia. The event view uses the same click threshold and includes 18 accounts.
Medians: We calculate each metric within each account, then take the account median. Placement ratios are also calculated within each account before taking their median. We keep zero values when the ratio is defined; a zero denominator is excluded. All money-based comparisons across currencies use within-account ratios.
Metric eligibility: ACoS is undefined when attributed sales are zero. August ACoS medians therefore use 49 accounts for Top of Search, 49 for Rest of Search and 50 for product pages; the Top of Search/product-page ACoS ratio uses 49. CVR, CPC, ROAS and their defined Top of Search/product-page ratios use all 50 accounts. All event metrics use 18 accounts.
Limitations: The analysis covers Sponsored Products only. It describes the consumer-brand accounts in this sample, rather than every seller on Amazon. Product mix, targeting, bids, modifiers and campaign objectives can affect placement results. We did not run a randomised placement-allocation test or estimate returns on additional spend.
We did not separate branded and non-branded traffic within placements, so differences in branded demand may influence the comparison. You can find more of our data studies on our research page.
Frequently asked questions
What is Amazon Top of Search placement?
Top of Search refers to the prominent sponsored placements at the top of Amazon search results. In this August sample, it had a median CVR of 14.8% across 50 accounts and median ACoS of 22.5% across 49 accounts with attributed sales.
Is Top of Search better than product pages on Amazon?
Top of Search showed stronger observed conversion and ACoS in most of this sample. That does not establish the best allocation for every campaign.
It had a higher CVR than product pages in 47 of 50 accounts and lower ACoS in 42 of the 49 accounts where both placements had defined ACoS. Product pages can still support defensive and competitor-targeting objectives.
How much more does a Top of Search click cost?
The median within-account Top of Search CPC premium was 20% over product pages in the August sample. In the separate October 6 to 7 event sample, it was 48%. These samples differ, so this is not a like-for-like estimate of the event's effect.
What Top of Search bid modifier should I use?
There is no universal modifier. Start with campaign-level placement results and a product-margin-based target. If Top of Search meets that target, test a small change and review spend, sales and ACoS after attribution matures before increasing it again.
What is a good ACoS for product page placements?
In our accounts, the median product page ACoS was 41.9%, with the middle half of accounts falling between 28.7% and 74.1% (n=50). Whether this is good or not for you, it depends on your margin and on what the campaign is there to do.
Know where your ad money works hardest
Every account has its placement mix, so the only way to know where your budget works hardest is to look at your own report. Get your free marketing plan from Olifant Digital and our team will look at your placements and identify where changes are worth testing against your growth and profit targets.

Alex is the founder and CEO of Olifant Digital, where his team manages over $100M in annual client revenue across 50+ brands on Amazon and ecommerce. He sets the agency's strategy and methodology, audits client accounts, and reviews the team's work to make sure every brand is on track to hit its growth and profitability goals. He also leads team training, so the performance data and lessons from across all accounts shape how every account manager runs their clients.



Mike reviews every Amazon article on this blog for strategic and technical accuracy before it publishes. As Director of Amazon Growth at Olifant Digital, he sets marketing strategy across client accounts and personally audits PPC at every stage of growth. He brings 8 years of daily Amazon operations across 7 and 8-figure brands including Beauty by Earth, Ekster, and Bullstrap, the kind of hands-on depth most agency directors delegate away.