Introduction
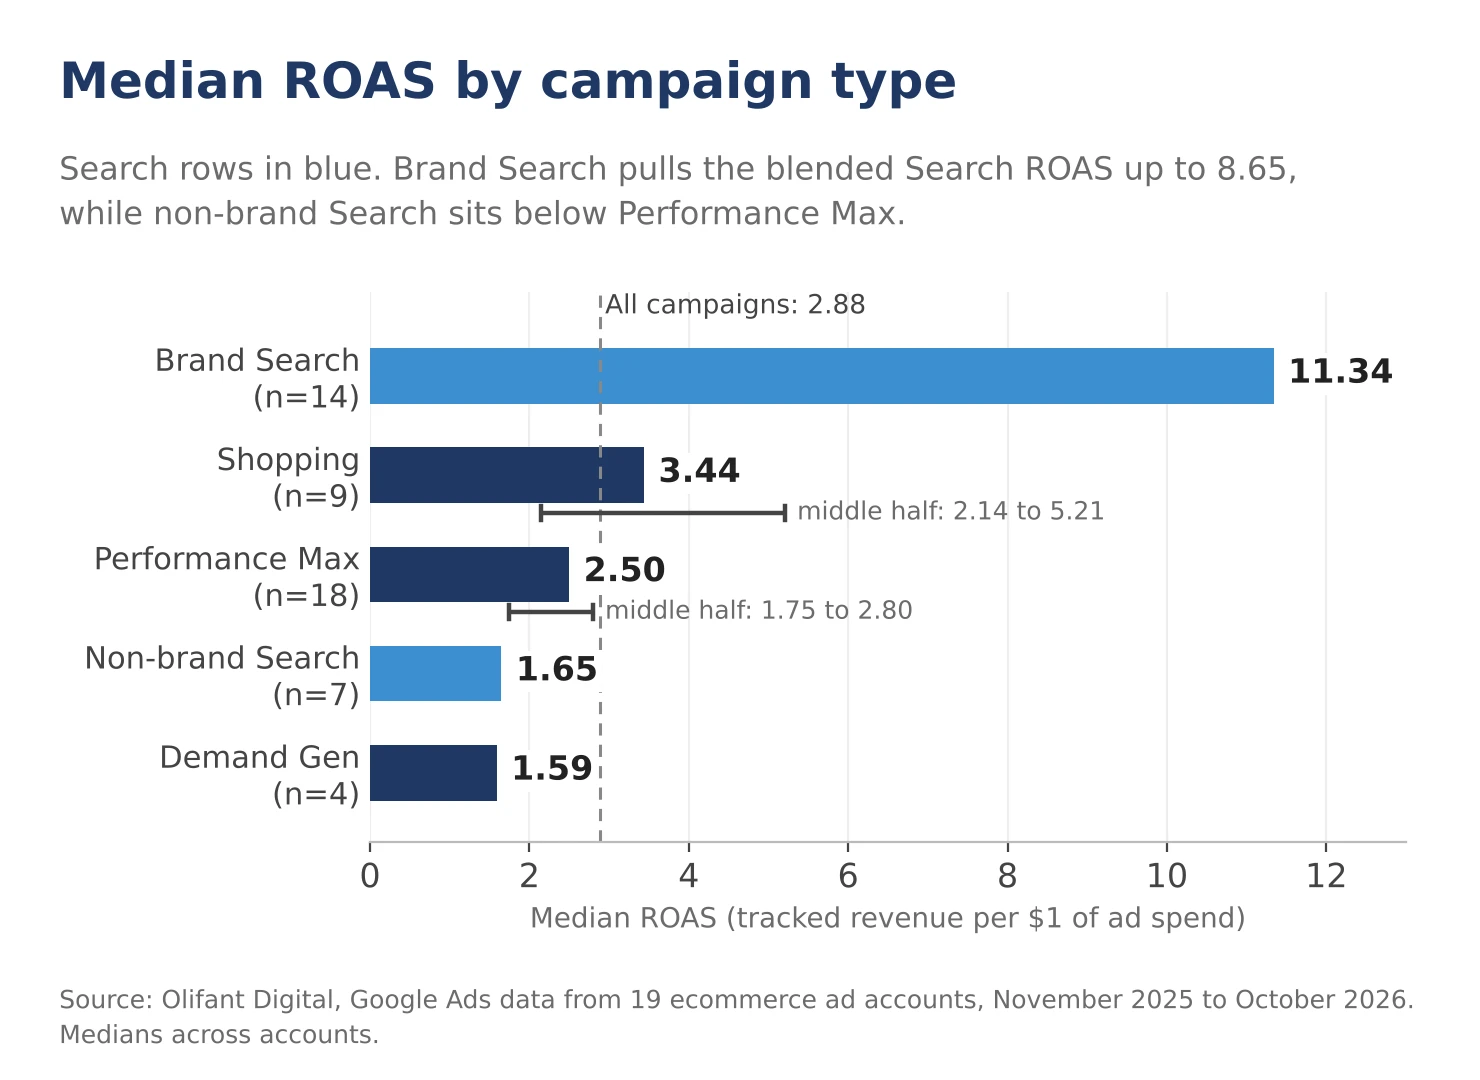
For the 19 ecommerce Google Ads accounts that we manage at Olifant Digital, the median account's Performance Max campaigns generated $2.50 in tracked revenue for every $1 spent in comparison to the $3.44 for Standard Shopping.
Search looks best with an 8.65 median ROAS, but that’s mostly brand search. The non-brand search returned only 1.65. These numbers are not coming from a survey, but they are based on Google Ads campaign-level data for the brands that we cover over the period of November 2025 to late October 2026.
The sample is made up of 19 ad accounts that are selling online in the US, Europe, the UK, and Canada. All of the figures in this article are medians across accounts. We use the median instead of the average so that one account with a very large budget cannot skew the result.
If you’re new to Google Ads, here’s a quick guide to the campaign types we compare. Search ads are text ads that show when someone searches something on Google.
Shopping ads are built from your product feed and show a product photo, a price, and your store name. Performance Max is a campaign type where Google decides where to serve your ads across Search, Shopping, YouTube, Display and Gmail.
Demand Gen runs image and video ads on YouTube, Gmail and Discover. It’s for people who aren’t looking for you yet.
Key findings
- Performance Max handles the bulk of the work. It was the largest campaign type in 16 out of the 19 accounts. The median account allocated 79% of its Google Ads budget to Performance Max, and it delivered a median ROAS of 2.50 (n=18).
- Performance Max vs. Shopping ROAS: Standard Shopping had a higher median ROAS than Performance Max: 3.44 (n=9) against 2.50 (n=18). Its cost per conversion was $23.78, against $44.24 for Performance Max.
- Brand search inflates the search results. The median ROAS for brand search was 11.34 (n=14), and for non-brand search it was 1.65 (n=7). Mix the two together and you have a misleading 8.65.
- Clicks are cheap but buyers are not cheap. The median cost/click across all campaigns was $1.21; however, only 3.4% of clicks converted (n=19).
- Demand Gen is a top-of-funnel play. It had the cheapest clicks at $0.46 but also had the lowest conversion rate at 0.6% and a median ROAS of 1.59 (n=4 to 5).
What are good Google Ads benchmarks for ecommerce?
In the table below, you can see the medians for each campaign type in our accounts, and all of the costs are in US dollars. In case you need a reminder, here is what each column stands for:
- CPC (Cost per Click) is what you pay every time someone clicks on your ad.
- CTR (click-through rate) is the share of people who see the ad and click on it.
- Conversion rate is the share of clicks that end up with a purchase or another tracked conversion.
- Cost per conversion is your ad spend divided by those conversions. ROAS, or return on ad spend, is the tracked conversion value that is divided by the ad spend, exactly as Google Ads reports it.
| Campaign type | Accounts (n) | CPC | CTR | Conversion rate | Cost per conversion | ROAS |
|---|---|---|---|---|---|---|
| Search (all) | 16 (14 for CVR, CPA, ROAS) | $0.92 | 17.5% | 6.6% | $12.85 | 8.65 |
| Shopping | 9 | $1.08 | 1.1% | 3.9% | $23.78 | 3.44 |
| Performance Max | 18 | $1.37 | 1.7% | 2.7% | $44.24 | 2.50 |
| Demand Gen | 5 (4 for CVR, CPA, ROAS) | $0.46 | 1.5% | 0.6% | $53.58 | 1.59 |
| All campaigns | 19 | $1.21 | 2.0% | 3.4% | $36.13 | 2.88 |
The columns don’t multiply out exactly, because each column is its own median. Therefore, you can't just take the median CPC and median conversion rate and get the median cost per conversion.
There is a big spread between accounts. The middle half of Performance Max accounts was between a ROAS of 1.75 and 2.80, and for Shopping it was 2.14 to 5.21. So we suggest you use these numbers as a range to check your own account against, not as a target you must hit.
Why is Search ROAS so high? Brand vs non-brand
Search looks like the star of the table above. However, if you break it down into brand and non-brand campaigns, the whole picture changes.
In our accounts, most Search spend goes to brand terms, for example, searches from people that have already typed your brand name into Google. For the accounts that we examined, brand campaigns made up a median of 84% of Search spend (n=16).
These shoppers are already looking for you, so there is no surprise that they click and buy at high rates.
We split our campaigns by sorting Search campaigns by name. Campaigns that are called “brand” went into the brand group, and the non-brand group included campaigns that are labeled “non-brand” or “NB” as well as campaigns that are targeting generic or competitor terms.
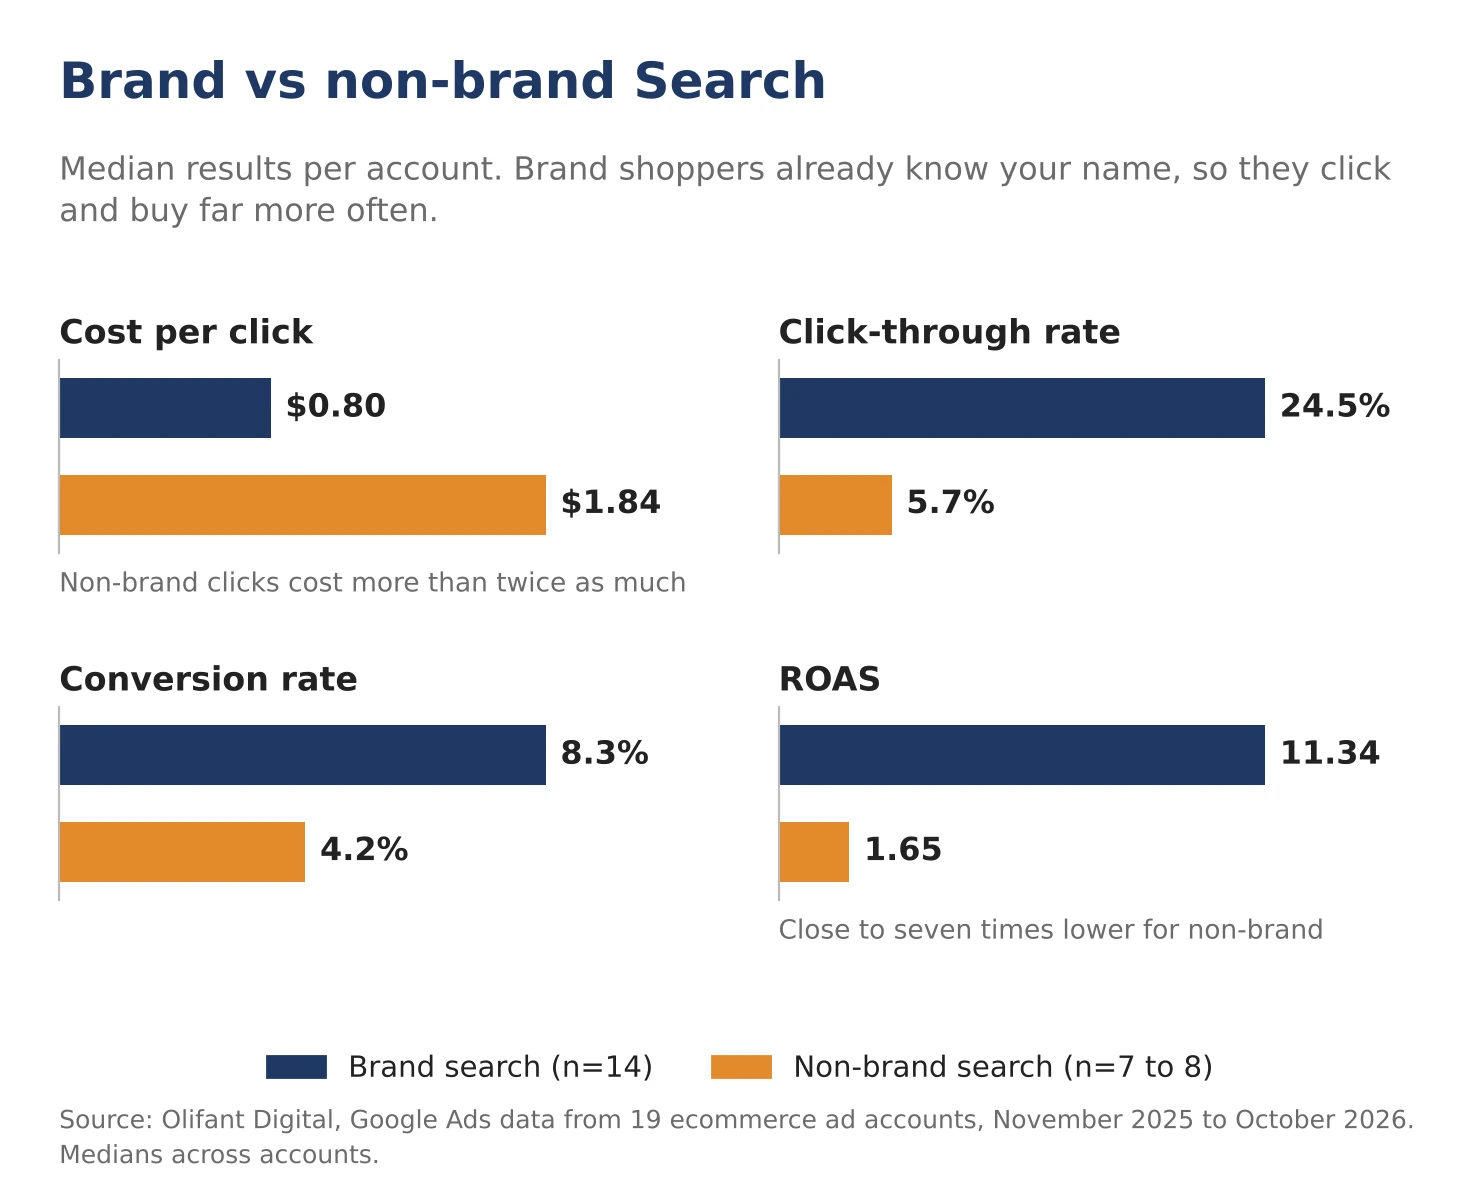
| Search type | Accounts (n) | CPC | CTR | Conversion rate | Cost per conversion | ROAS |
|---|---|---|---|---|---|---|
| Brand search | 14 | $0.80 | 24.5% | 8.3% | $11.45 | 11.34 |
| Non-brand search | 8 (7 for CVR, CPA, ROAS) | $1.84 | 5.7% | 4.2% | $38.59 | 1.65 |
Non-brand clicks are more than twice as expensive as brand clicks, and ROAS tends to drop from 11.34 to 1.65, which makes it nearly seven times smaller.
Brand search still has a job to do, which is to protect your name when competitors bid on it. However, lots of these brand sales would have likely happened anyway, through the free listing that is directly below the ad.
This is why you should not judge your entire Google Ads account by a blended Search ROAS that is mostly brand. The same also goes for Amazon and we have it covered in our guide to branded vs. non-branded budget allocation.
Shopping vs Performance Max: which returns more?
In our accounts, Standard Shopping had a higher median ROAS (3.44, n=9) in comparison to Performance Max (2.50, n=18). Its cost per conversion was also lower at $23.78 in comparison to $44.24.
This simply doesn’t mean that Shopping is the better ad campaign, because Performance Max also ends up running ads on YouTube, Display and Gmail and also targets shoppers who may not be familiar with your brand yet.
Shopping campaigns are often set up around best-selling products, and these tend to convert easily. It is also worth noting that Shopping ran in only 10 of the 19 accounts at all.
We look at this question in more detail in an upcoming study on our research page. Both of these campaigns rely on having a clean product feed, so if your results are looking weak, you should check our guide to Google Merchant Center feed optimization.
How do ecommerce brands split their Google Ads budget?
Performance Max is now the default for all 19 accounts in this study. It was run by all 19 accounts and was the biggest type of campaign in 16 of them.
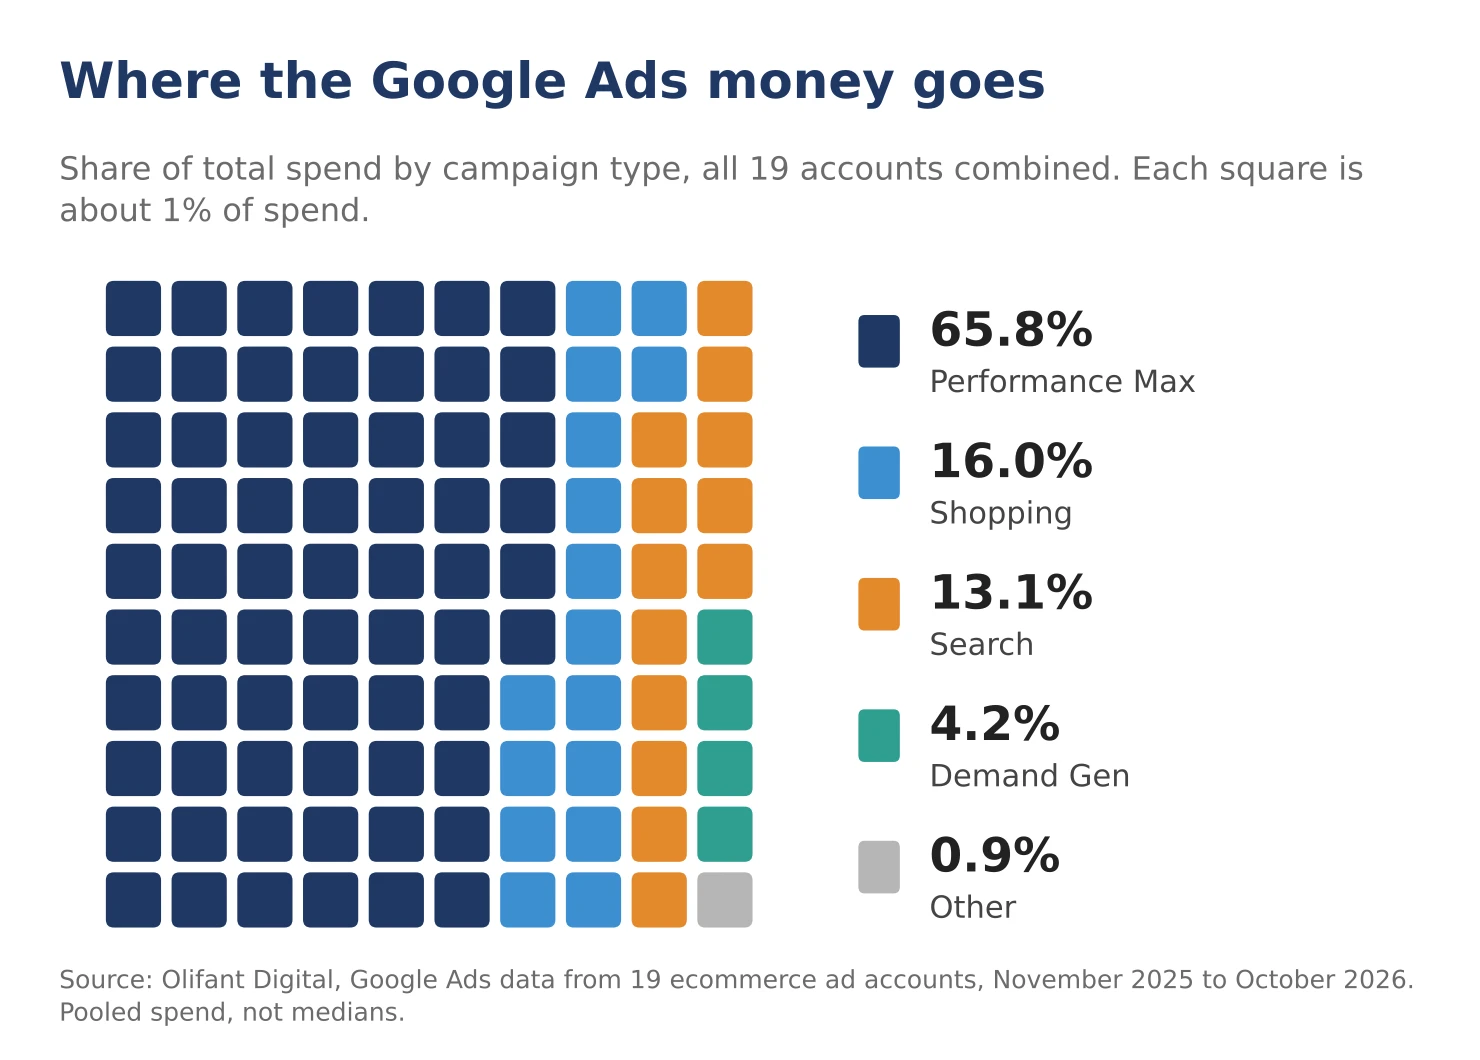
| Campaign type | Accounts using it (of 19) | Median share of spend (accounts using it) | Share of total spend, all accounts combined |
|---|---|---|---|
| Performance Max | 19 | 79% | 66% |
| Search | 16 | 18% | 13% |
| Shopping | 10 | 10% | 16% |
| Demand Gen | 9 | 1% | 4% |
The two share columns tell different stories so it is helpful to read them side by side.
An account that runs Shopping typically gives it about 10% of its budget. But some accounts put much more into Shopping and in total it accounts for 16% of all spending across the accounts. For the 9 accounts that run Demand Gen, it’s still a small test budget (a median of 1% of spend).
Is a Google Ads ROAS of 2 good for ecommerce brands?
This truly depends on your margins. A ROAS of 2.50 means that you are making $2.50 of the revenue for every dollar that you spend on ads. For example, a gross margin of 60% leaves you with $1.50 of gross profit from that $2.50, meaning you made $0.50 after paying for the ad.
If your margin is 35%, the same ROAS ends up losing money on the first order. There are two other things that matter when you judge your number.
1. Repeat buyers: A brand that has strong repeat sales can take a lower ROAS on the first order, because the customer will continue to buy later. However, a brand that sells a one-off purchase doesn't have that buffer.
2. Tracking: Google Ads ROAS uses Google’s own conversion tracking, which can count sales that would have happened anyway and it can miss sales that have occurred on another device. Check out Google’s guide to attribution models, and it’s a good idea to compare its numbers along with your Shopify or store data.
One of the fastest ways to make the same ROAS more profitable is to increase your order value. This task can be done with our guide on increasing AOV on Shopify.
What this means for your brand
Here is how we use these numbers with the brands that we manage.
First, we split out branded vs. non-branded search in each report. If you only see one Search ROAS, you need to ask for the split. A blended ROAS of 8 can mask a non-brand ROAS of less than 2.
Next, we judge Performance Max at around 2 to 3 ROAS. In our accounts, the middle half sat between 1.75 and 2.80, so if you happen to be well below that, it’s important to check your feed and your product mix along with tracking before you add more budget.
Test standard Shopping next to Performance Max. Shopping returned more per dollar in the accounts where it ran. It works really well for the products that you want to have full control over.
You need to give Demand Gen time and a different goal. With a 0.6% conversion rate, it will rarely look good on last-click ROAS. It’s important to judge it by new visitors and the sales that come later and not by day one revenue.
Finally, set your target based on your margin, not on a benchmark. You need to work out the break-even ROAS for your product first. After that, you can use these medians to see whether your account sits in a normal range.
If you’re also selling on Amazon, you can compare those numbers with our Amazon ads benchmarks. Also, if you’re thinking about getting outside help, here is how we think about choosing an ecommerce Google Ads agency.
How we collected this data
- Source: Campaign-level monthly data from Google Ads (cost, impressions, clicks, conversions and conversion value) for the ecommerce brands that we manage at Olifant Digital.
- Period: November 1, 2025, to October 26, 2026
- Sample: 19 Google Ads accounts that sell products online. There are brands that run separate accounts for different countries, so the number of brands is a little lower than 19. Markets include the US, Europe, the UK, and Canada. Categories include pet care, golf, baby and kids, beauty, food and drink, gifts, and home and phone accessories.
- Medians, not means: every figure is the median across accounts, and ranges show the middle half of accounts.
- Thresholds: an account counts for a campaign type only if it spent at least $1,000 and received at least 100 clicks for that type. Conversion rate and cost per conversion, along with ROAS, also requires at least 10 conversions. This is why “n” constantly changes from row to row.
- Currency: accounts in euros, pounds and Canadian dollars were converted to US dollars at fixed average rates (EUR 1.13, GBP 1.33, CAD 0.72). This change only affects CPC and cost per conversion. CTR, conversion rate and ROAS are not affected.
- Exclusions: Our own agency accounts, accounts that are for lead generation or courses, an account whose ads send traffic to Amazon (without store conversion value), accounts with no data in the period and test or lead generation campaigns that are inside client accounts.
- Brand vs. non-brand: We split by campaign name, so a few mixed campaigns may sit in the wrong group.
- Limitations: This is what our data shows for the ecommerce brands we are managing, not the whole market. ROAS uses Google’s own attribution. Shopping, non-brand search, and Demand Gen are run by fewer accounts, so you need to compare those rows along with your data.
Frequently asked questions
What is a good ROAS for Google Ads in ecommerce?
The median ROAS across all campaigns in our 19 accounts was 2.88. Shopping was 3.44, and Performance Max was 2.50. You need to get your break-even ROAS first, and what is good for you depends on your margin.
What is the average CPC for ecommerce Google Ads?
The median cost per click across all the campaigns in our accounts was $1.21.
Demand Gen had the cheapest click at $0.46, and of Search, Shopping and Performance Max, the cheapest was brand search at $0.80. Non-branded searches were the costliest at $1.84.
What is a good conversion rate for Google Shopping?
Across the 9 accounts we reviewed, Standard Shopping campaigns converted a median of 3.9% of clicks into sales. Performance Max was lower, at 2.7% across 18 accounts.
One reason for the gap is that Shopping campaigns are often built around best-selling products that people are already looking for, while Performance Max also shows ads to people who are simply browsing. In our accounts, the median Shopping conversion rate was 3.9%, so that is a useful reference point for your own account.
Why is my Google Search ROAS so much higher than Performance Max?
Brand search is the reason in most cases. Those campaigns bring back a lot because people typing your brand name into Google already know you and are ready to buy.
In our accounts, brand search had a median ROAS of 11.34, and non-brand search only 1.65. When you look at the two separately, Search often looks much closer to Performance Max than the blended number suggests.
How much of the budget should go to Performance Max?
There is no strict rule because it depends on your products and what else you run. For the majority of the brands we manage, Performance Max still holds the largest share.
The median account dedicates 79% of its Google Ads spend to this type, and it’s the biggest campaign type in 16 of the 19 accounts. If you’re spending significantly less than that, it’s not necessarily a problem. Just make sure your other campaigns are performing well.
If you want to see how your Google Ads compares to these numbers, grab your free marketing plan, and our team at Olifant Digital will walk you through your account. Every account is different, and your margin, your product mix and your tracking all play a role in determining what a good result looks like for you.

Alex is the founder and CEO of Olifant Digital, where his team manages over $100M in annual client revenue across 50+ brands on Amazon and ecommerce. He sets the agency's strategy and methodology, audits client accounts, and reviews the team's work to make sure every brand is on track to hit its growth and profitability goals. He also leads team training, so the performance data and lessons from across all accounts shape how every account manager runs their clients.