Introduction
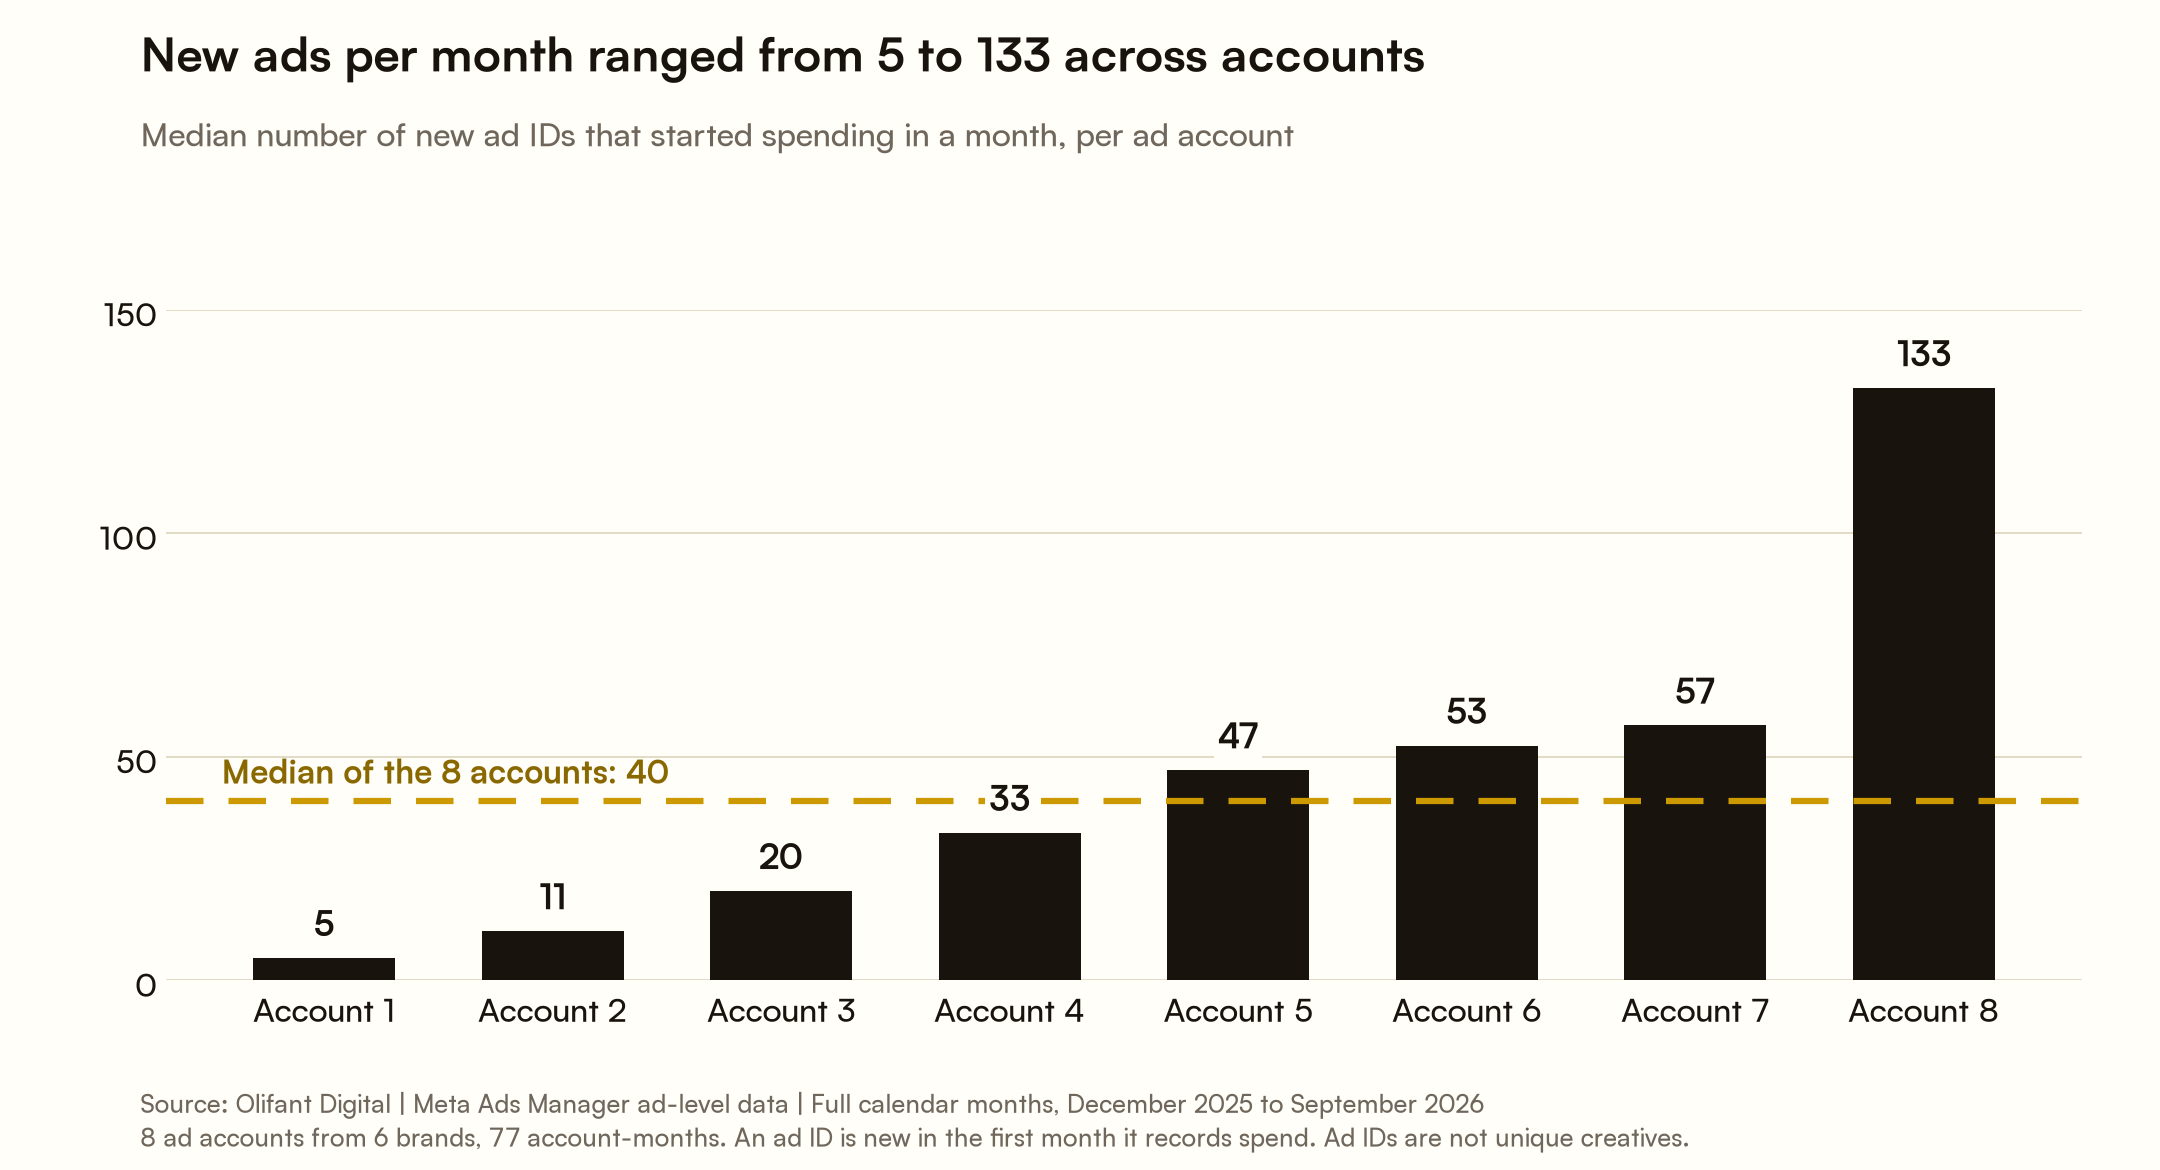
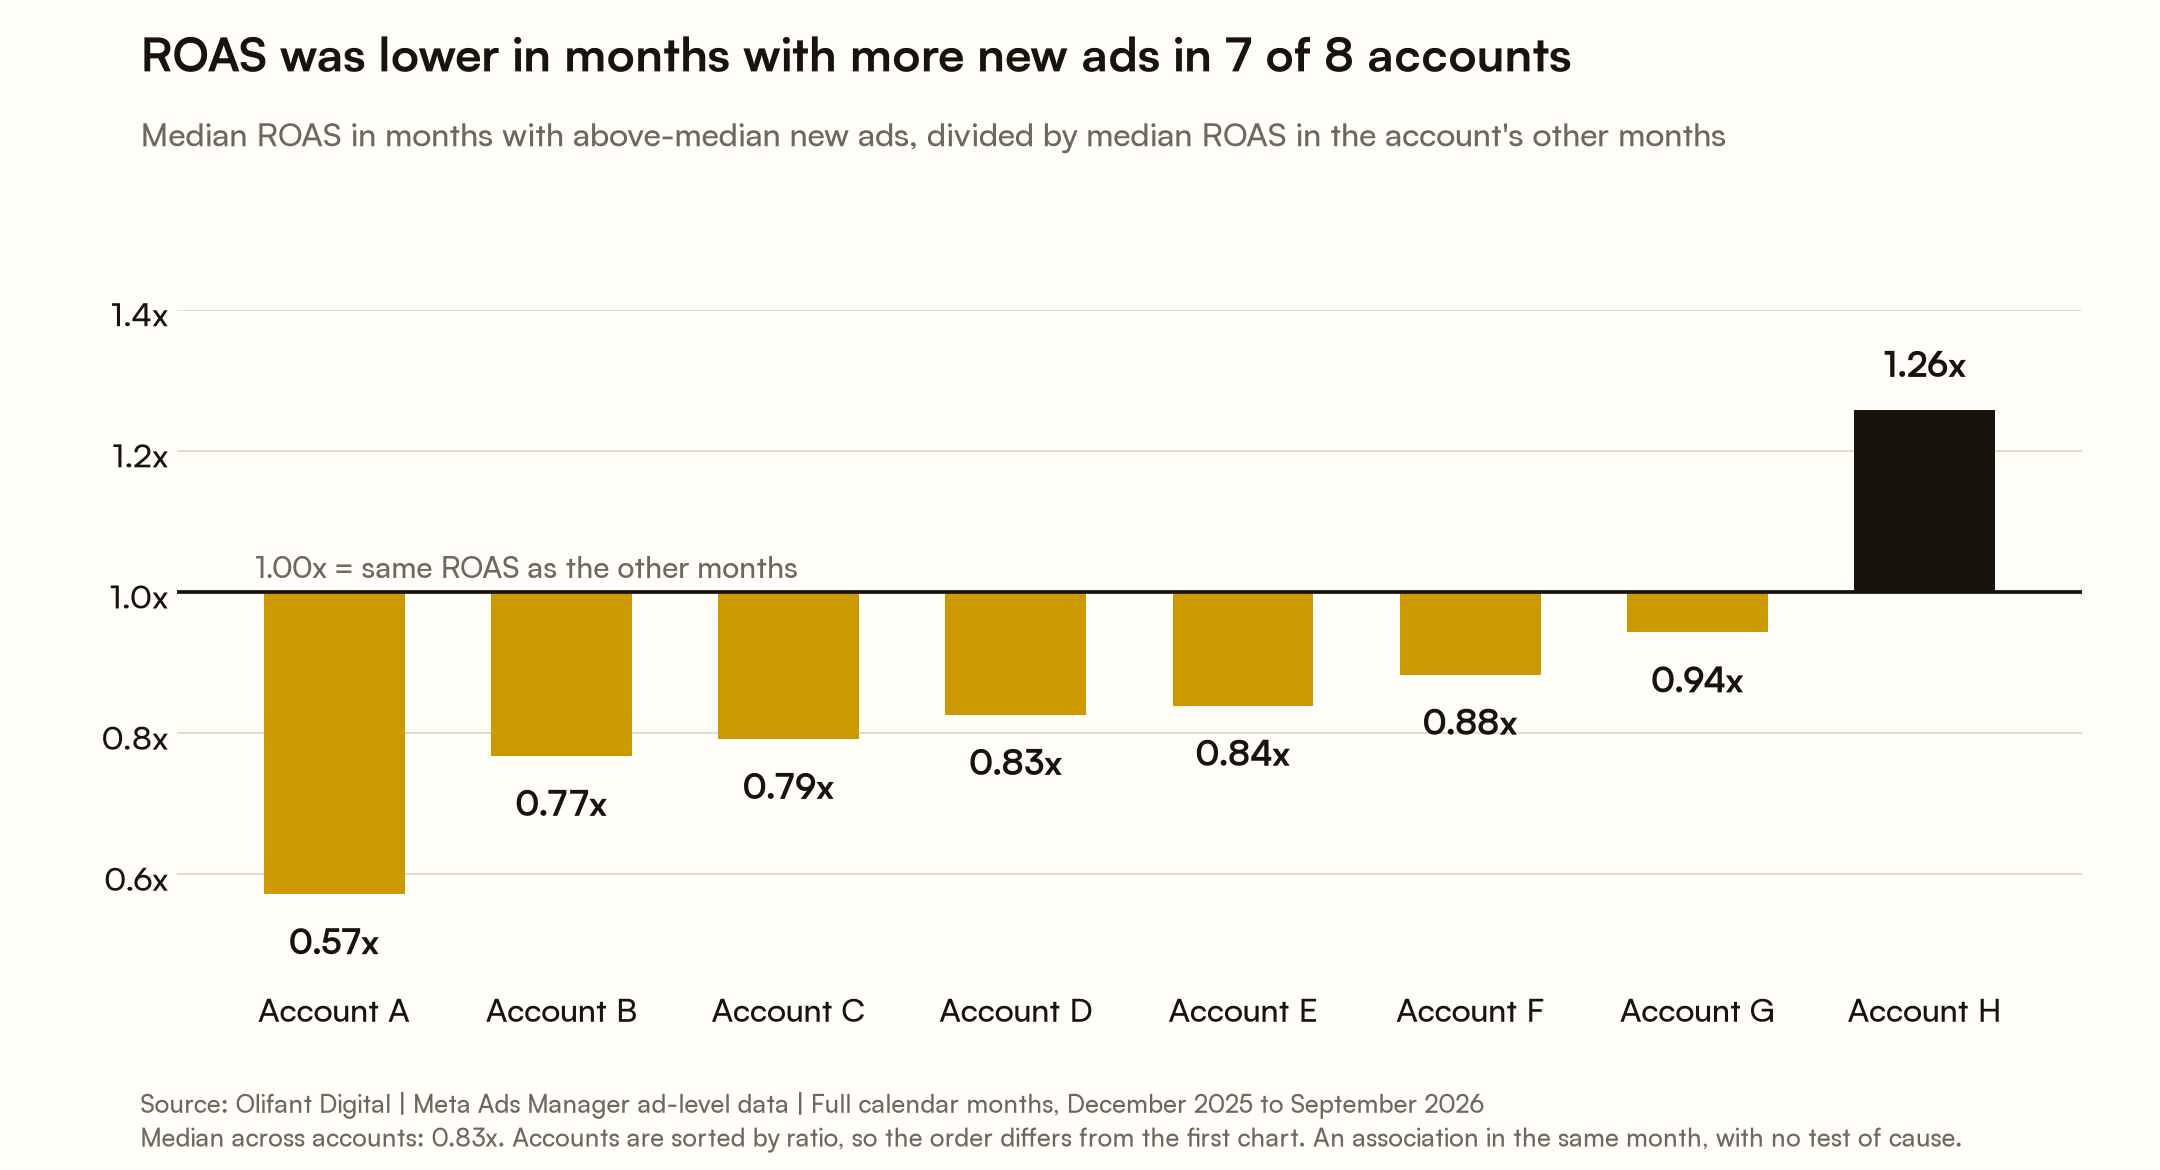
The median ecommerce ad account we manage put 40 new Facebook and Instagram ads into spend each month, and those new ads received a median 23% of the month’s spend. In months when an account added more new ads than usual, ROAS was lower in 7 of 8 accounts, at a median 0.83 times the ROAS of the same account’s other months. Spend in those months was about the same, at 1.04 times.
These numbers come from one year of ad-level data from Meta Ads Manager, covering 10 ad accounts from 8 ecommerce brands that Olifant Digital manages. The period runs from October 27, 2025 to October 26, 2026.
One definition matters for everything below. We count ad IDs. One image, video or concept can run under several ad IDs, so the number of new ads is higher than the number of new creative ideas. An ad is new in the first month it records spend in our dataset, and that month can be later than the day the ad was created.
If you are planning how many creatives to produce next month, the sections below show what these accounts did and what happened to ROAS, click-through rate and spend around it.
What did we find in the data?
- The median account added 40 new ads a month. The 8 account medians ranged from 5 to 133 new ad IDs a month. New ads received a median 23% of monthly spend.
- Months with more new ads had lower ROAS. In months with more new ads than the account’s own median, ROAS was a median 0.83 times the ROAS of the other months and was lower in 7 of 8 accounts. Spend was 1.04 times.
- Scaling months showed no clear difference. Spend grew by more than 10% from one month to the next in 31 account-months. The median ROAS change was -2% in the 16 months with many new ads and +5% in the 15 months with few. The gap is small and it reverses under a stricter growth cutoff.
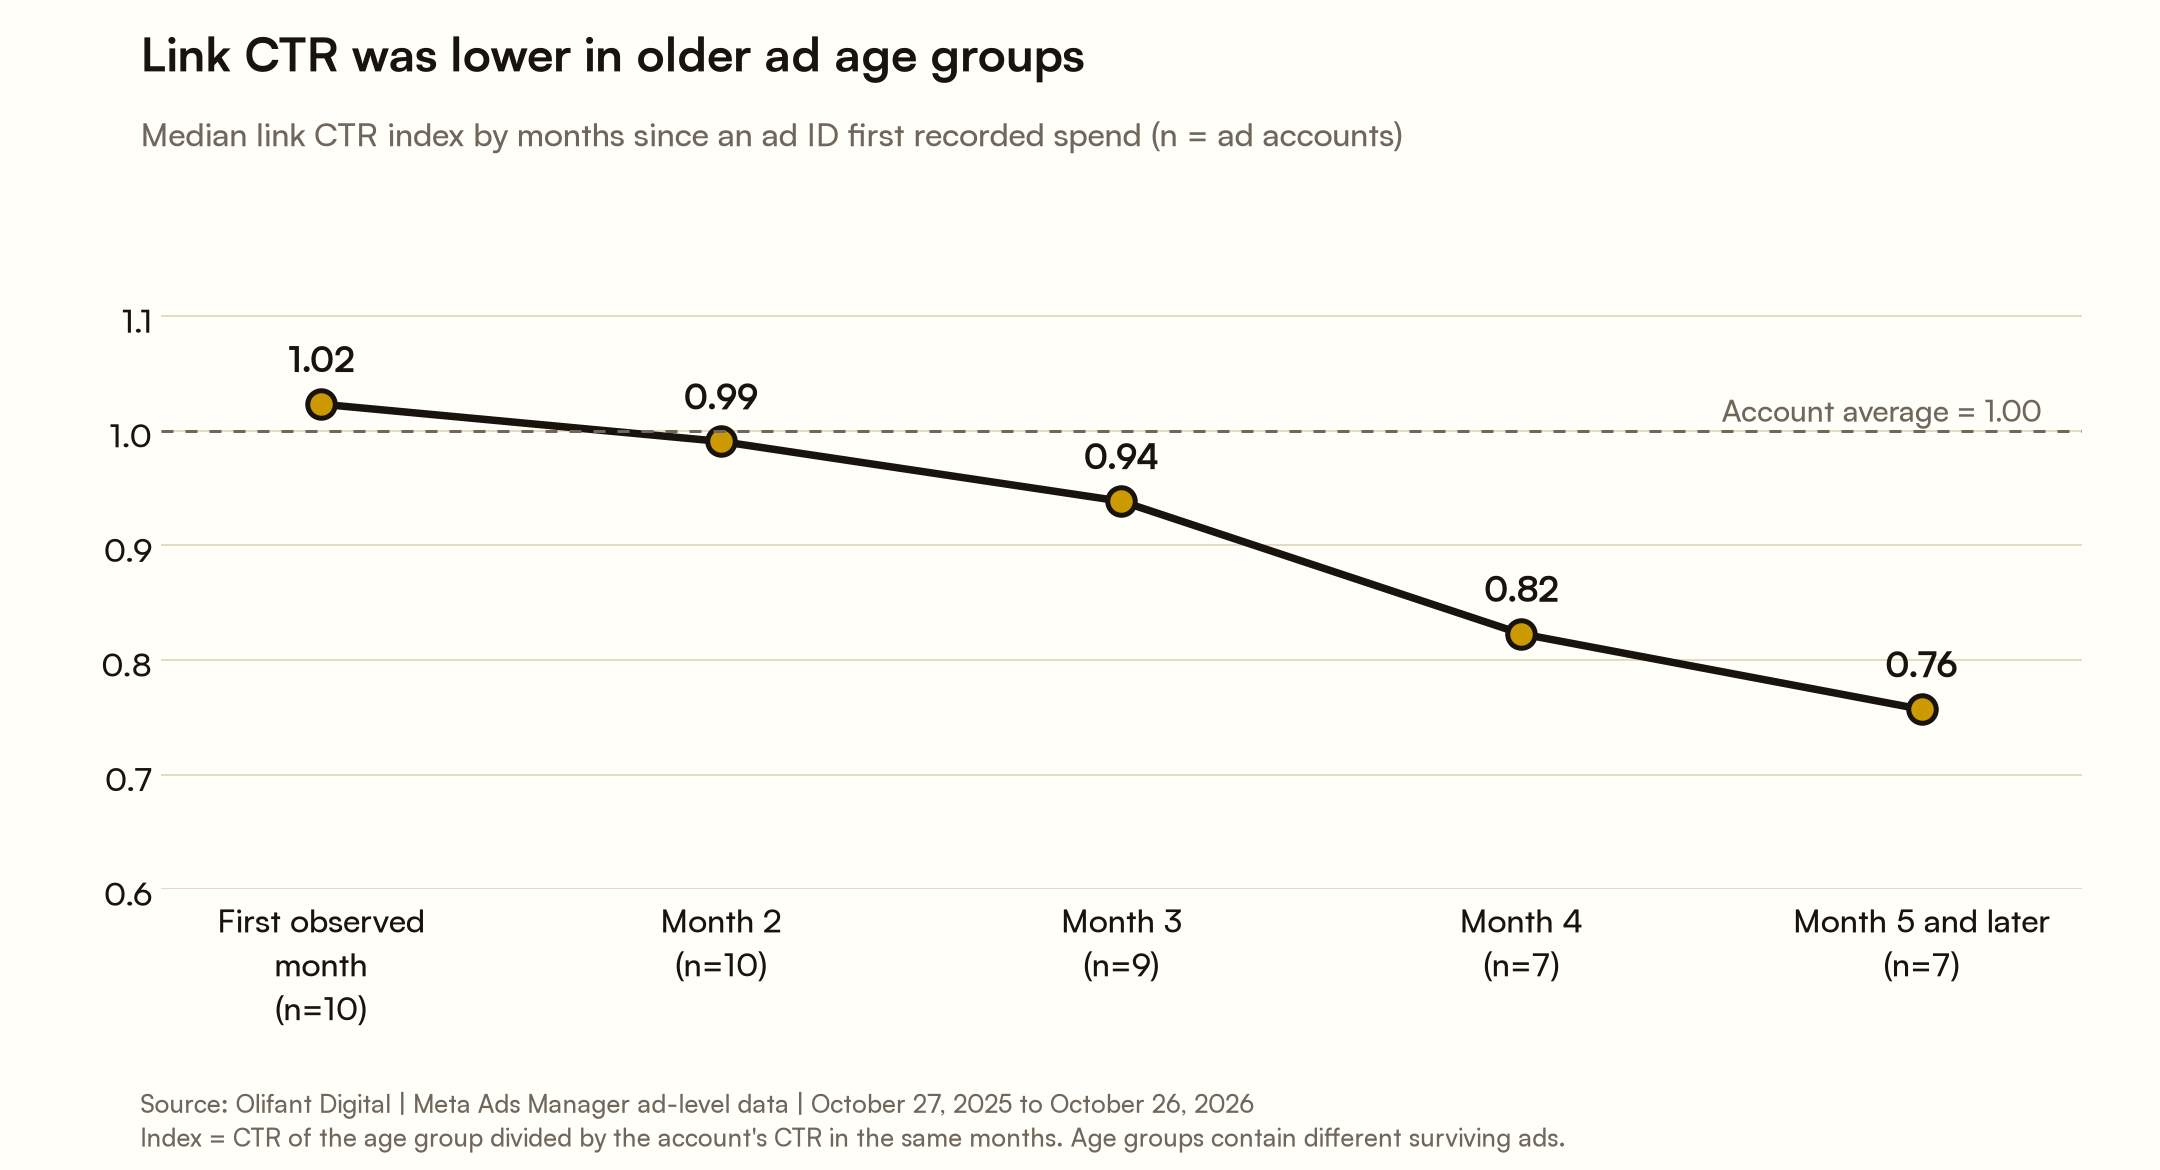
- Older ad age groups had a lower click-through rate. The median link CTR index was 1.02 in an ad’s first observed month, 0.82 in month four and 0.76 in month five and later.
- A small share of ads received most of the spend. The top 10% of ad IDs received a median 64% of spend. A median 56% of ad IDs recorded no purchase, and those ads received 9% of spend.
How many new ads do ecommerce brands launch each month?
In the accounts we manage, the median account added 40 new ad IDs a month. Before the table, here is how we counted.
We used full calendar months only, from December 2025 to September 2026. An ad ID counts as new in the first month it records spend, as long as it recorded no spend earlier in our data. The data starts on October 27, 2025, so we used the period up to the end of November 2025 as a look-back and did not count new ads in it. Without a look-back, ads that were already running would be counted as new.
A month counted when the account spent at least 200 in its reporting currency. An account counted when it had at least 4 such months. That leaves 8 accounts from 6 brands and 77 account-months.
| Measure (8 accounts, 77 account-months) | Result |
|---|---|
| New ad IDs per month, median account | 40 |
| Lowest and highest account median | 5 to 133 |
| Share of monthly spend on new ad IDs, median account | 23% |
| Lowest and highest account median share | 5% to 47% |
Each account’s figure is the median of its own months. The headline figure is the median of the 8 account medians, so one large account cannot set the result.
The range is wide. One account added about 5 new ads in a typical month, and another added more than 130. The number depends on budget, on how many products and markets the account covers, and on how the account is built. An account that copies the same creative into several ad sets creates several ad IDs from one creative.
Ad names give a rough sense of that reuse. In the median account, 51% of ad IDs shared their ad name with at least one other ad ID in the same account. Names are an imperfect guide, so this figure only shows that reuse is common.
The share of spend on new ads also varied, from 5% to 47% of a typical month depending on the account. In the median account, about a quarter of the month’s spend went to ad IDs that had not spent before, and the rest went to ad IDs that were already running.
Do more creatives mean better ROAS?
In our data, months with more new ads did not have better ROAS. In most accounts they had lower ROAS.
We split each account’s months into two groups. High-volume months are the months in which the account added more new ad IDs than its own median. All other months are the comparison group. Across the 8 accounts, that gives 37 high-volume months and 40 other months. We then divided the median ROAS and the median spend of the high-volume months by the same figures for the other months, inside each account.
| Same-account comparison (8 accounts) | High-volume months vs other months |
|---|---|
| ROAS, median ratio across accounts | 0.83x |
| Accounts with lower ROAS in high-volume months | 7 of 8 |
| Monthly spend, median ratio across accounts | 1.04x |
| Accounts with higher spend in high-volume months | 5 of 8 |
This is an association in the same month. It does not show that new ads caused the lower ROAS. Brands often add many ads around a sale, a new product or a new market, and those months differ from normal months in other ways too. We did not run a controlled test.
The result also depends on how November 2025 is treated. November is not in the comparison above, because our look-back before it is only five days long. If we include it anyway, the comparison covers 9 accounts. ROAS in high-volume months is then 0.88 times the other months and lower in 5 of 9 accounts, and spend is 1.31 times. The direction stays the same, and the size of the gap depends on the method.
Can new creatives protect ROAS while you scale?
Our data cannot answer this with confidence. We looked for it and found no clear difference.
We took every pair of back-to-back calendar months in which an account’s spend grew by more than 10%. There were 31 such account-months across 8 accounts. We split them by whether the account added more new ad IDs than its own median in the month of growth, and compared ROAS with the month before.
| Months with spend up more than 10% (31 account-months) | Account-months | Median ROAS change vs prior month | Months with lower ROAS |
|---|---|---|---|
| Many new ad IDs (above account median) | 16 | -2% | 9 of 16 |
| Few new ad IDs (at or below account median) | 15 | +5% | 5 of 15 |
This table pools account-months, so accounts with more growth months weigh more. It is the only result in this study that is not a median across accounts.
Months that scaled with fewer new ads had a slightly better median ROAS change, and ROAS fell in fewer of them. The gap is small next to the spread: in both groups, single months ranged from large drops to large gains. It also does not hold under a stricter cutoff. When we count only months with spend up more than 20%, the median change is +7% with many new ads (12 months) and +5% with few (11 months).
So we cannot say that adding creatives protects ROAS during a budget increase, and we cannot say that it hurts. With 31 observations, this question needs more data or a controlled test.
When does Facebook ad creative fatigue set in?
Older groups of ads had a lower click-through rate in our data. We grouped each ad ID’s spend by the number of months since it first recorded spend. For each age group, we divided its link CTR, ROAS and cost per purchase (CPA) by the account’s own figures for the same months. An index of 1.00 means the same as the account average.
| Ad age | Accounts (n) | CTR index | ROAS index | CPA index | Share of spend |
|---|---|---|---|---|---|
| First observed month | 10 | 1.02 | 0.90 | 1.18 | 40% |
| Month 2 | 10 | 0.99 | 0.93 | 1.10 | 24% |
| Month 3 | 9 | 0.94 | 1.09 | 0.92 | 7% |
| Month 4 | 7 | 0.82 | 1.08 | 0.93 | 7% |
| Month 5 and later | 7 | 0.76 | 1.07 | 0.95 | 5% |
Medians across accounts. Share of spend is the median share of each account’s spend after its look-back period, so the column does not add up to 100%. Spend on ads that were already running in the look-back period is not in the table.
The median CTR index was 1.02 in the first observed spending month, 0.82 in month four and 0.76 in month five and later. These age groups contain different surviving ads and, at older ages, fewer accounts.
That last point matters for reading the table. The table compares groups of ads. It does not follow one ad over time, so it does not show that a typical ad loses this much CTR as it gets older.
The ROAS and CPA columns need the same care. Ads in month three and later had a higher ROAS index and a lower CPA index than newer ads. Ads that sell poorly are usually switched off early, so the older groups mostly contain ads that performed well enough to stay live. The higher ROAS of older ads reflects which ads survived.
The spend column shows how much of the budget sat with young ads. A median 40% of spend went to ads in their first observed month and 24% to ads in their second month. In those two groups the CPA index was 1.18 and 1.10.
How many ads actually win?
Few of them. Spend piled up on a small share of the ads.
| Concentration (10 accounts from 8 brands) | Median across accounts |
|---|---|
| Ad IDs with spend in the year, per account | 506 |
| Spend share of the single biggest ad ID | 7% |
| Spend share of the top 10% of ad IDs | 64% |
| Ad IDs with no reported purchase | 56% |
| Spend share of ad IDs with no reported purchase | 9% |
In the median account, the top 10% of ad IDs received 64% of the year’s spend, and the figure ranged from 51% to 83% across the 10 accounts. More than half of the ad IDs, 56%, never recorded a purchase in Meta’s reporting. Those ads were cheap to try: together they received 9% of spend.
This is the practical case for a steady supply of new ads. Most ads receive little spend and record no sale, and a few carry the account. The data does not tell you in advance which ones those will be.
What does this look like inside one account?
The figures above are medians across accounts. The two examples below come from a single account we manage, from September to November 2026. They are outside the study’s dataset, and we checked each number against the account’s Meta data. The last paragraph describes how we plan creative work in general.
A testing budget buys a first signal. In one week, a 20% testing share of the account’s spend, split evenly across 10 concepts, came to about $20 a day per concept. At the account’s cost per purchase of $29 that week, each concept would collect about 5 purchases in a week. Five purchases can show which concept deserves more budget next. They are too few for a final verdict. In our reports, an ad that has received very little spend is labeled “not sufficiently tested” and stays in the queue.
Winners fade. In the same account, a video ad had a ROAS of 3.48 over about six weeks and 2.44 in the following two weeks. A static ad went from 3.35 to 1.50 over the same periods. Both were paused. An ad’s past result does not guarantee its next month.
How we plan the mix. We plan creative work around a 70/20/10 split: about 70% of spend on proven winners, 20% on new versions of those winners, such as a new hook on the same video, and 10% on completely new concepts. We call an ad a winner once it has 5 or more purchases at a cost per purchase below the account’s own average. This is a planning target. Inside a campaign budget, Meta decides how much each ad receives, so actual spend rarely matches the split. This study did not test whether 70/20/10 is the best split.
What does this mean for your brand?
Use the observed volume as a reference when planning tests, then set your pace around budget, conversion volume and the number of genuinely different ideas you can evaluate. This study does not establish an optimal weekly launch schedule or testing-budget share.
The points below are starting points to test in your own account.
Count ideas as well as ads
A month with many new ad IDs can still contain few new ideas. Track how many distinct concepts you tested, separately from how many ads you launched.
Size each test in purchases
Divide your testing budget by the number of concepts, then by your cost per purchase. If the answer is 1 or 2 purchases per concept, you are testing more concepts than the budget can judge.
Expect most ads to record no sale
In our accounts, a median 56% of ad IDs recorded no purchase, on 9% of spend. If your account looks similar, that is normal. Judge each ad on purchases and cost per purchase.
Watch CTR as an ad gets older
When an ad’s link CTR falls well below the level it had when it started spending, test a new version of it. You can keep the same offer and try a new hook or a new first frame. This study did not test a specific CTR threshold, so set one from your own account history.
Judge scaling months on your own numbers
Our data did not show that adding creatives protects ROAS during a budget increase, or that it hurts. When you raise the budget, compare ROAS with the month before and note how many new ads went live. After a few such months you will have your own answer.
Your landing page and offer matter as much as the ad. If ROAS drops while CTR is steady, look at the store first, starting with how to increase AOV on Shopify and abandoned cart recovery. Before peak season, go through our Shopify Black Friday checklist.
How we collected this data
- Source: Ad-level insights from Meta Ads Manager (Facebook and Instagram) for ecommerce brands Olifant Digital manages, exported by month.
- Period: October 27, 2025 to October 26, 2026. The first and last periods are partial months (October 27 to 31, 2025 and October 1 to 26, 2026).
- Sample: 10 ad accounts from 8 brands in categories such as golf, supplements, home goods and other consumer products. One brand runs three regional accounts, and we counted those separately. One account has data from August 2026 only.
- What we count: Ad IDs with spend. An ad ID is one ad in Ads Manager. The same image, video or concept can run under several ad IDs, so these figures do not count unique creatives, and they are not formal creative tests.
- New ads: An ad ID is new in the first full calendar month it records spend, if it recorded no spend in any earlier period in the data. Each account’s first period and its first full month are a look-back and have no new-ad count. For most accounts the counted months are December 2025 to September 2026.
- Eligible months: Full calendar months with spend of at least 200 in the account’s reporting currency (USD, EUR or GBP). The floor is not converted between currencies. Months with a ROAS of zero would count, and there were none.
- Volume and ROAS comparisons: Accounts with at least 4 eligible months: 8 accounts from 6 brands, 77 account-months. Ratios are calculated inside each account and the median is taken across accounts.
- Scaling comparison: Pairs of back-to-back calendar months, both eligible, where spend grew by more than 10%. This comparison pools 31 account-months from 8 accounts. Where a calendar month is missing or below the spend floor, the pair is left out.
- Ad age: Months between the month an ad ID first recorded spend and the month of the spend. All periods count, including the partial ones. Ads that were already spending in the look-back period are left out because their age is unknown.
- Indices: Each age group’s CTR, ROAS and CPA is divided by the account’s own figure for the same months, so 1.00 means equal to the account average. CTR is link click-through rate. Accounts report in different currencies, so we use ratios and never add money across accounts.
- Purchases and ROAS: As reported by Meta (pixel and Conversions API). They can differ from the store’s own sales.
- Format: We do not report video and static results. The export has no verified creative format field, and a split based on video plays would be a guess.
- Limitations: These are ecommerce brands we manage, and most are mid-size. The comparisons use 8 to 10 accounts, and 7 accounts in the oldest age groups. The study describes what happened in these accounts. It was not a controlled test, and the associations do not prove cause. Results for older ads reflect which ads survived.
You can find more of our data studies in our research library.
Frequently asked questions
How many creatives should I test on Facebook ads?
There is no single number. In the accounts we manage, the median account added 40 new ad IDs a month, and account medians ranged from 5 to 133. These are ad IDs, so the number of distinct creative ideas was lower.
Set your own number from your budget and your cost per purchase, so that each concept can collect enough purchases to be judged.
When does Facebook ad creative fatigue start?
In our data, the median link CTR index was 1.02 in an ad’s first observed month, 0.94 in month three, 0.82 in month four and 0.76 in month five and later. These are different groups of ads at each age, so they are a rough guide.
Watch each ad’s own CTR against the level it had when it started spending.
Will more creatives improve my ROAS?
In our data, months with more new ads did not have better ROAS. ROAS in those months was a median 0.83 times the account’s other months, and it was lower in 7 of 8 accounts. This is an association and does not prove that new ads lowered ROAS.
How many Facebook ads actually make sales?
Fewer than half in our accounts. In the median account, 56% of ad IDs recorded no purchase, and the top 10% of ad IDs received 64% of spend.
Should I scale budget with new ads or proven ads?
Our data does not settle it. In months when spend grew by more than 10%, the median ROAS change was -2% with many new ads and +5% with few, across 31 account-months. The gap is small and reverses under a stricter cutoff.
Track your own scaling months before you decide.
Build a creative plan on your own numbers
Every account differs in how many ads it can test and how fast its ads wear out. The numbers in this study are a reference point for your own plan.
Olifant Digital is a full-service Amazon agency. We also run Facebook and Instagram ads for Amazon brands that also sell on their own store. If you want a testing plan built on your own ad data, get your free marketing plan from Olifant Digital.

Alex is the founder and CEO of Olifant Digital, where his team manages over $100M in annual client revenue across 50+ brands on Amazon and ecommerce. He sets the agency's strategy and methodology, audits client accounts, and reviews the team's work to make sure every brand is on track to hit its growth and profitability goals. He also leads team training, so the performance data and lessons from across all accounts shape how every account manager runs their clients.