

Amazon Agency for Home and Kitchen Brands

Olifant Digital runs Amazon for kitchen tool, home goods and DIY brands: strategy, PPC, listings, A+ content, stock and account health. Listings justify a higher price, and bids follow margin.

If performance does not improve in 60 days, we refund our management fees
Your home and kitchen account, run day to dayamazon.com
What we run for your home brand
PPCBids set on marginListingsScale and use imagesA+Comparison chartsFeesSize tiers checkedStockPrime Day and Q4ReportingTACoS per ASIN
Our footprintHome and kitchen brands we run on AmazonKitchen tools, home goods, furniture and DIY
Dreamfarm, Jan to Sep 2026 vs 2025+328%UK Amazon sales for the Brisbane kitchen brand, with US sales up 45%
Live listings of a brand we manage
Live listing image of a brand we manage
Dreamfarm

Dreamfarm Champop Champagne Bottle Opener Easy Twist Cork Popper

Live listing image of a brand we manage
Dreamfarm

Dreamfarm Eggler 2-in-1 Compact Egg Shell Peeler & Easy Hardboiled Egg Slicer, Shell Cracking, Topping, & Peeling - Yellow

Dreamfarm figures from its Amazon sales data. Titles and images are live catalogue data.

Key facts for home and kitchen brands

Updated · Reviewed by Alex Stoykov, CEO of Olifant Digital

  • 31.1%median ACoS on home and kitchen accounts (all our accounts: 34.8%)
  • $1.93median cost per click on home and kitchen accounts (all our accounts: $1.80)
  • 6.5%of home and kitchen ad clicks turned into orders, median (all our accounts: 8.2%)
  • +328%UK Amazon sales for Dreamfarm, January to September 2026 against 2025, with US sales up 45%
  • 7+ yearsof Amazon experience for each specialist on home and kitchen accounts, at an Amazon Ads Partner with 50+ accounts

Source: the home and kitchen accounts we manage on Amazon.com, September 2026. Each number is the median across those accounts (Sponsored Products, $300+ of ad spend). Brand results are from our published case studies.

Selling home and kitchen on Amazon

What is different about selling home and kitchen on Amazon

Home and kitchen products cost more, take up more space and sell hardest in a few weeks of the year. Fees, images and timing decide the margin.

FEE

Size tiers and fees

  • FBA fees step up with size tier and dimensional weight
  • Bulky fees changed again in 2026
  • Margin checked per product before ad targets are set
IMG

Images that show scale

  • Shoppers need size, materials and use in the images
  • Comparison charts in A+ across your range
  • Main images tested in Amazon experiments
Q4

Peaks

  • Q4 gifting and Prime Day carry much of the year
  • Stock sent in weeks before demand rises
  • Budgets raised as gifting searches climb
RTN

Returns and reviews

  • Return reasons read for listing fixes
  • Size and damage complaints fed back into the listing
  • Vine for the first reviews on new products
1P

Seller and Vendor

  • Seller Central and Vendor Central both supported
  • Content and catalog kept in line on each
  • Amazon Ads run for both account types

Want your margins checked?

Send your range. We check fees, listings and ad cost per product and show you where the margin goes.

Get your free marketing plan

Fee and fulfilment rules change during the year; we check Amazon's current fee tables for your products.

Our home and kitchen data

What our home and kitchen accounts on Amazon show

Median Sponsored Products results per account, September 2026, from the Amazon.com accounts we manage. Home and kitchen has the biggest orders of any category we run, and the slowest decisions.

CategoryMedian ACoSMedian ad conversion
Home and kitchen brands31.1%6.5%
All categories we manage34.8%8.2%

Accounts with $300 or more of September ad spend. Conversion = orders per ad click, Amazon's 7-day window.

Four things we see in home and kitchen accounts

Order value

The biggest baskets we see.

A median order of $142.18 against $41.52 across all our accounts. One order pays for many clicks.

Conversion

Shoppers take their time.

6.5% of ad clicks became orders, against 8.2%. Listings have to answer every question before the buy.

Clicks

Clicks are not cheap.

A median CPC of $1.93, above the $1.80 average. Broad terms that pull in browsers cost real money.

ACoS

Lower ACoS, despite all that.

31.1% median ACoS against 34.8%. High order values cover the click cost when the listing converts.

Read home and kitchen ad costs against order value and margin after fees.

Home and kitchen results

Home and kitchen brands we run on Amazon

A Brisbane kitchen brand we run on three marketplaces, and a US DIY brand whose UK launch had not taken off.

Dreamfarm listing imageDreamfarm listing imageDreamfarm listing image

Dreamfarm

Kitchen tools · Brisbane, Australia
AUUKUS
+328%UK Amazon sales, Jan to Sep 2026 vs 2025

Vendor Central in Australia, Seller Central in the US and UK, each with its own listings and campaigns. US sales grew 45% over the same months.

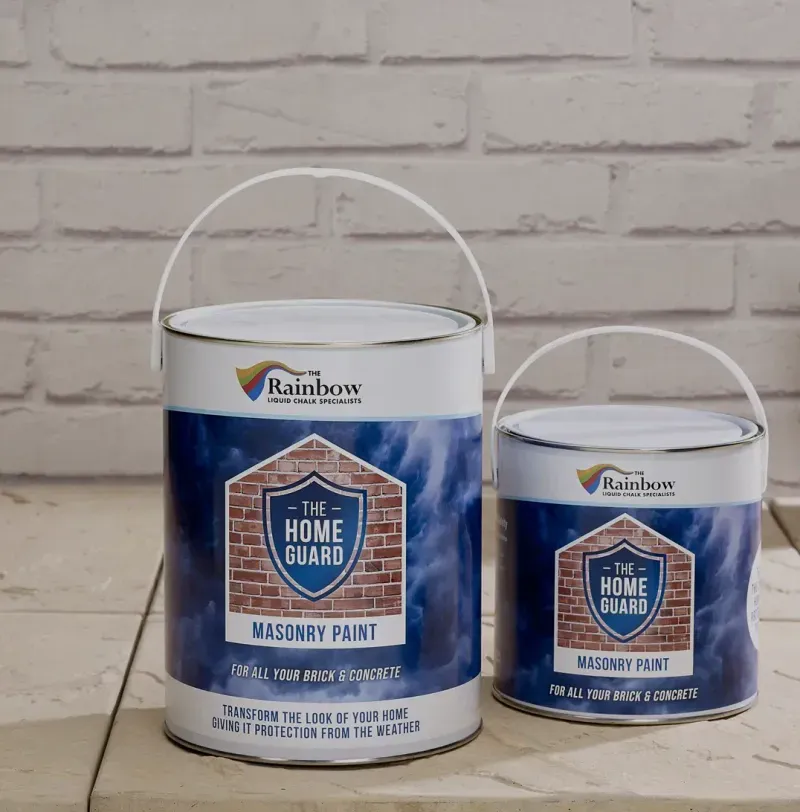
Rainbow Chalk listing imageRainbow Chalk listing image

Rainbow Chalk

Liquid chalk markers · home and DIY
UK
+21%UK Amazon revenue in 30 days

US keywords replaced with British search terms, products moved into the right subcategories and listings tested until conversion climbed. It earned the Best Seller badge in its UK category.

Amazon Ads Partner50+Amazon accounts we work on across marketplaces
Median order$142on our home and kitchen accounts, the highest of any category we run
Selling to Amazon as a vendor?See Vendor Central

Product images and titles from Dreamfarm's live catalogue. Figures from its Amazon sales data and the Rainbow Chalk case study.

Our approach

Where home and kitchen brands lose margin on Amazon

Three things that cost home and kitchen brands money, and what we do about each.

Shoppers who look and leave

What holds brands back
X sign

Clicks come in, but at a higher price point only a few buyers order. The ads look expensive and get cut.

Home and kitchen shoppers compare for longer. Images, dimensions, materials and reviews have to answer every question before they buy.

How we fix it
Checkmark

We build listings that close a considered purchase.

Images that show size, use and materials, comparison charts in A+, and answers to the common questions in the bullets.

Why home and kitchen ads look costlySeptember 2026
MetricHome and kitchen vs all accounts
Median order value$142.18 vs $41.52
Median CPC$1.93 vs $1.80
Ad conversion6.5% vs 8.2%
Median ACoS31.1% vs 34.8%

Per-account medians, Sponsored Products, Amazon.com, September 2026.

Fewer orders, bigger baskets.Bids set by our PPC team. See PPC Management

Expensive clicks spent on browsers

What holds brands back
X sign

The brand bids on broad terms like kitchen gadgets or storage bins, and spend climbs faster than orders.

Home and kitchen clicks are among the costliest in our data, and broad terms pull in shoppers looking for something else.

How we fix it
Checkmark

We fund the searches with buying intent.

Product and use-specific keywords, competitor pages where you win on price or reviews, and broad terms cut when they do not sell.

One kitchen brand, three marketplacesDreamfarm
MarketJan to Sep 2026 vs 2025
UK, Seller Central+328% sales
US, Seller Central+45% sales
AustraliaVendor Central, run by us

From Dreamfarm's Amazon sales data.

Each market run on its own plan.Kitchen tools from Brisbane. See International Expansion

Fees and peaks that eat the margin

What holds brands back
X sign

A product sells well until fulfilment fees change, or stock runs out three weeks before the holidays.

Fees step up with size tier and dimensional weight, bulky fees changed again in 2026, and much of the year's demand lands in Q4.

How we fix it
Checkmark

We plan size, stock and peaks months ahead.

Margin checked per size tier, stock planned for Prime Day and Q4, and budgets raised before gifting searches peak, not after.

The home and kitchen calendarPer year
WhenWhat we plan
January to MarchHome projects, listing tests
SpringCleaning, outdoor and DIY demand
SummerPrime Day stock and deals
September to OctoberQ4 stock sent in early
November to DecemberGifting searches, budgets up

Your own calendar comes from your sales history.

Stock in before the peak.Planned with our inventory team. See Inventory Management
Olifant AI

Every bid and budget change is backed by data and made by a specialist

Olifant AI reads your home and kitchen ad data daily against margin per product, so costly clicks that do not convert are caught early. Specialists set the bids and budgets.

Olifant AI block showcase
Tech
Daily keyword and order data
Client position in Olifant Ai process
You are here!
Olifant team bridging between client and tech
Talent
Specialists act the same day
TechDaily keyword and order data
You are hereYour brand, your goals and your data
TalentSpecialists act the same day
In their words

Hear it from the founders

Owners of home and DIY brands on working with the team that runs their Amazon accounts.

What impressed me the most were the results Olifant delivered and the way they communicate with me and my team. Their team uses Slack to keep everything clear, and the communication is super quick. They not only helped our brand grow, but also helped me understand the “why” behind the success.
Nick EdnieNick EdnieManaging Partner at Rainbow ChalkRead the case study
Your team

Meet our Amazon team

A full team runs your account, on Seller Central, Vendor Central or both,
led by specialists with 7+ years on Amazon.

Account manager

Your main contact. Plans peaks and launches with you and runs the monthly TACoS review per product.

PPC specialists

Manage bids on expensive keywords and run tests by product and price point.

Listing specialists

Build listings that justify a higher price, with sizes, materials and use cases made clear.

Designers

Create lifestyle, dimension and comparison images, A+ and the Brand Store.

Video editors

Edit demo and assembly videos that show the product working.

Catalog and account health

Handle catalog, variations, stock and account health cases on Seller or Vendor Central.
Why us

Why work with Olifant Digital

What you get when we work together.

Home results

Dreamfarm's UK sales grew 328% and Rainbow Chalk's UK revenue 21% in 30 days.

Listings that close

Images, A+ and comparison charts that answer buyers before they leave.

Margin first

Fees, size tiers and returns checked before ads scale.

Seller and Vendor

Seller Central and Vendor Central accounts run side by side.

How Olifant Digital compares

Olifant Digital vs a general Amazon agency vs doing it yourself
Olifant DigitalA general Amazon agencyDoing it yourself
Home brands we runOn Amazon.com, plus the UK and AustraliaDepends on the agencyOnly yours
ImagesScale, use and comparison imagesDepends on the agencySupplier photos
KeywordsProduct and use searchesBroad category termsWhatever ranks today
FeesMargin checked per size tierRarely reviewedFound on the invoice
PeaksPrime Day and Q4 planned months aheadDepends on the agencyPlanned in November
TestingAmazon experiments on images and A+SometimesNot done
Vendor CentralRun alongside Seller CentralOften not offeredHandled by the sales team
ReportingTACoS per product, every monthPlatform dashboardsSeller Central exports

Swipe to compare →

How working with us starts

You get the margin review, the listing fixes and the peak plan before you decide.

step one

Share your range

Your best sellers, price points, lead times and the markets you sell in.

step two

Get the plan

Margin per size tier, listing and A+ fixes, the keyword plan and a calendar for the peaks.

step three

Talk to the team

Meet the people who would run the account, then pick a start date.

If performance does not improve in 60 days, we refund our management fees.

Olifant Digital
See how fast we can scale your home and kitchen brand on Amazon.

See how fast we can scale your home and kitchen brand on Amazon

Answer 5 quick questions and get your free marketing plan in 24 hours.

Get your free home brand marketing plan