Introduction
In January 2026, the median brand that we manage sold 25% less per day on Amazon than it did in December; however, it sold almost exactly the same as on a normal early-November day (0.99x), so the “January slump” that many sellers worry about is mostly the holiday spike that is coming to an end and not a fall below normal sales.
This is not a survey. We actually pulled daily Amazon order data from Seller Central for the brands that Olifant Digital manages, which gives us 21 brands for January 2026 and 19 brands for January 2025. The data counts all orders, not only those that came from ads.
If you run an Amazon brand and January feels a little scary, this study shows you how big the drop really is, which part of the month is the weakest, and when your sales are likely to come back.
Key findings
- January is about 25% below December. If you look at the median brand that we work with, an average day in January was 0.75x that of an average day in December in 2026, and in 2025 it was 0.86x (n=21 and n=19).
- In 2026, the last week of January was the weakest one. This was the lowest week for 11 of the 21 brands that we looked at. In 2025, it was the third week that came out the weakest most often (7 of 19).
- Half of the brands never see a drop. In the first two weeks of January 2026, 10 of 21 brands were selling at 95% or more of their normal level.
- February stays flat, and March gets better. In 2026, the median brand’s February came in 1% above its January, whereas March came in 7% above. In 2025, those numbers were 5% and 9%.
How much do Amazon sales drop in January?
The answer depends on what you compare January with. Most of the sellers put January next to December and this comparison always looks bad. December is the second half of the holiday season, so January is going to look weak next to it almost every year.
In this study, we used a fixed baseline instead. The baseline is the average day from November 1 to 14 of the same season, before the Black Friday deals start. It is the same baseline that we used in our Black Friday sales study, so you can read the two pieces side by side.
When you see “0.99x” below, it means 0.99 times a normal early-November day for that brand. All figures are medians across brands, so one big brand can’t pull the result up or down on its own.
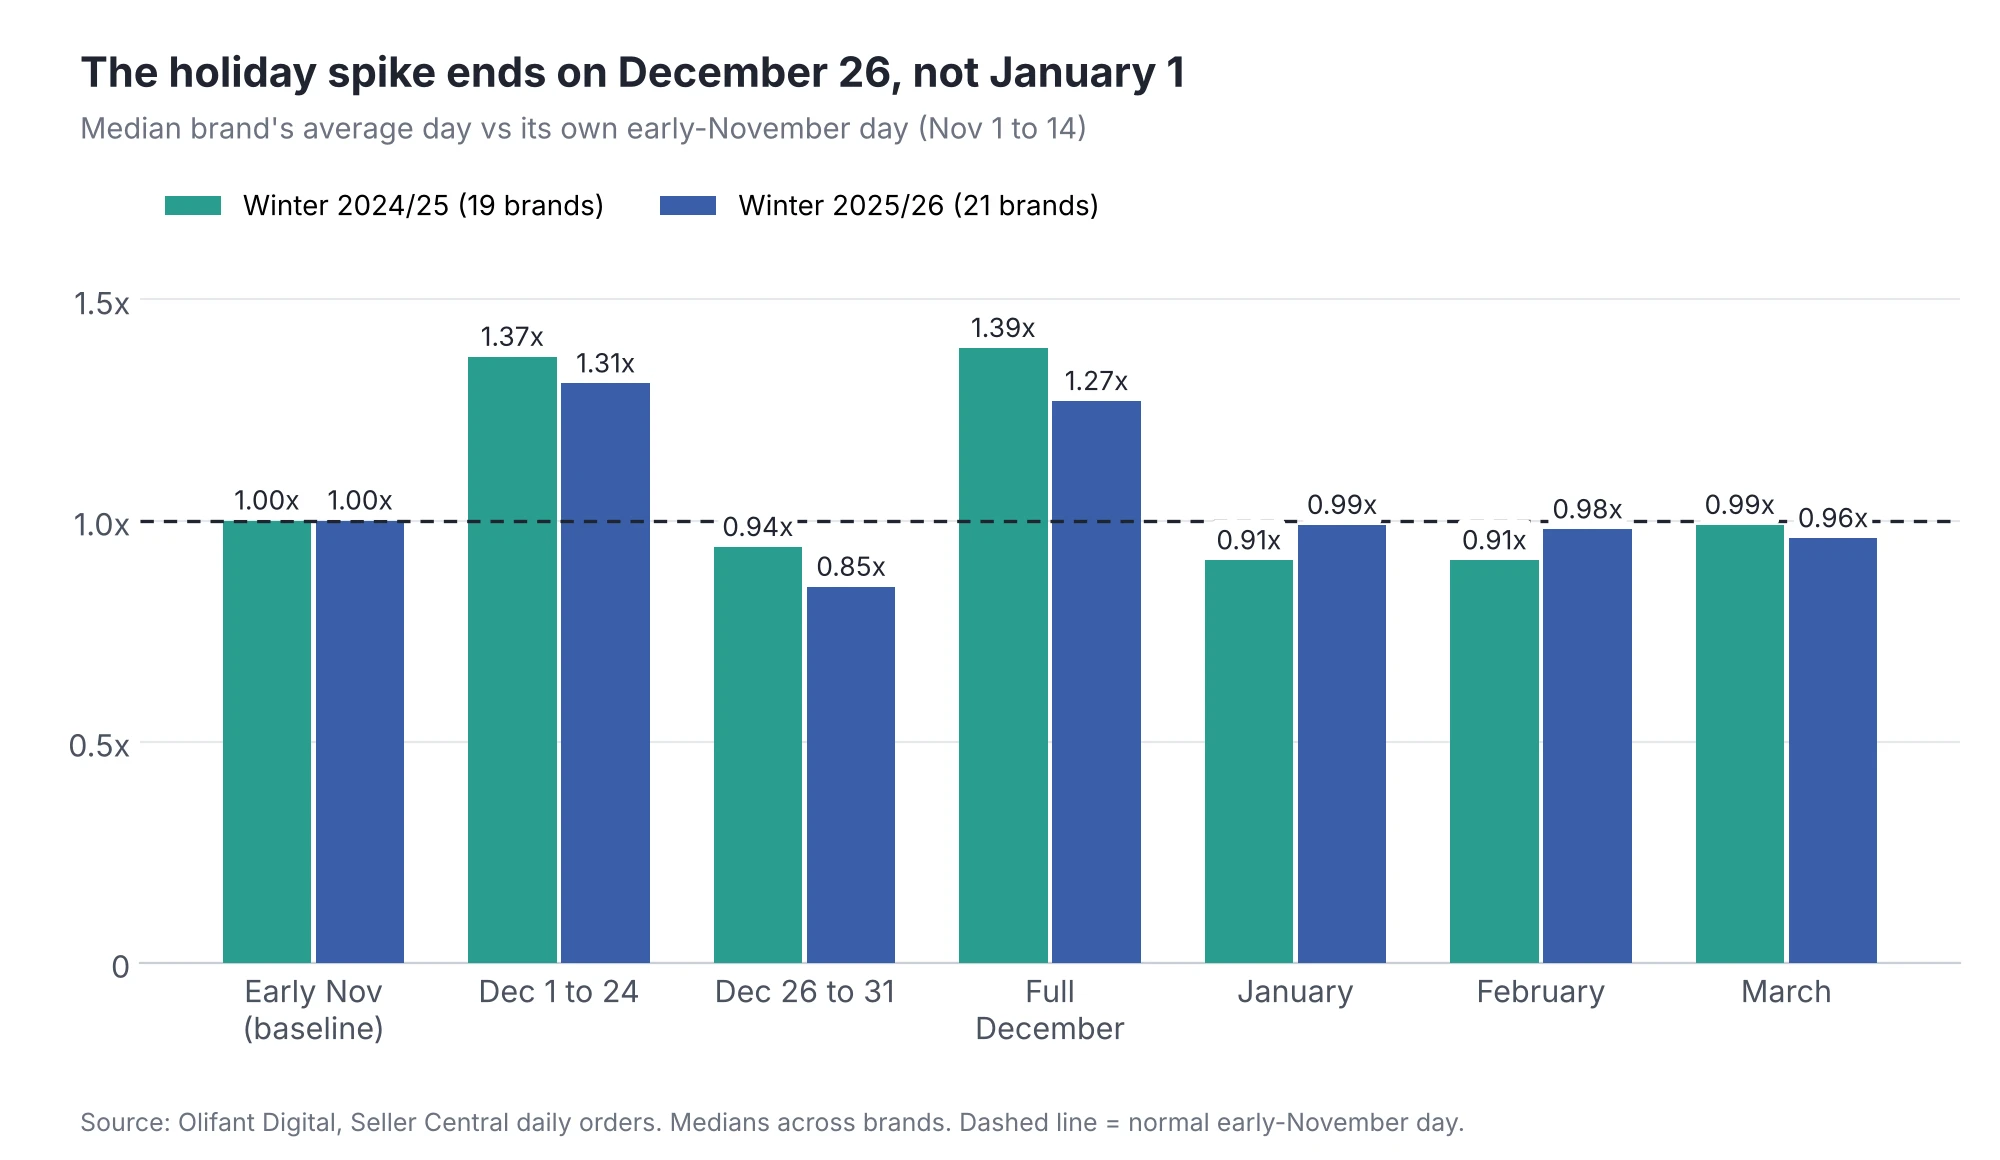
| Period (average day) | Winter 2024/25 (19 brands) | Winter 2025/26 (21 brands) |
|---|---|---|
| Early November (baseline) | 1.00x | 1.00x |
| December 1 to 24 | 1.37x | 1.31x |
| December 26 to 31 | 0.94x | 0.85x |
| Full December | 1.39x | 1.27x |
| January | 0.91x | 0.99x |
| February | 0.91x | 0.98x |
| March | 0.99x | 0.96x |
In our data, the bigger your December is, the bigger your January drop looks. In 2026, a quarter of brands sold 42% or more less per day in January than they did in December. Brands that had a strong gift season usually end up in this group.
At the other end, about a quarter of brands sold the same or more in January. This is what you should expect from products that people buy for themselves rather than as gifts.
So, before you panic about a January report, you should ask yourself one question. Is January below December, or is it below normal? Only the second one is a real problem for your brand.
Which week of January is the weakest?
To find the low point, we split January into four parts: days 1 to 7, 8 to 14, 15 to 21 and 22 to 31.
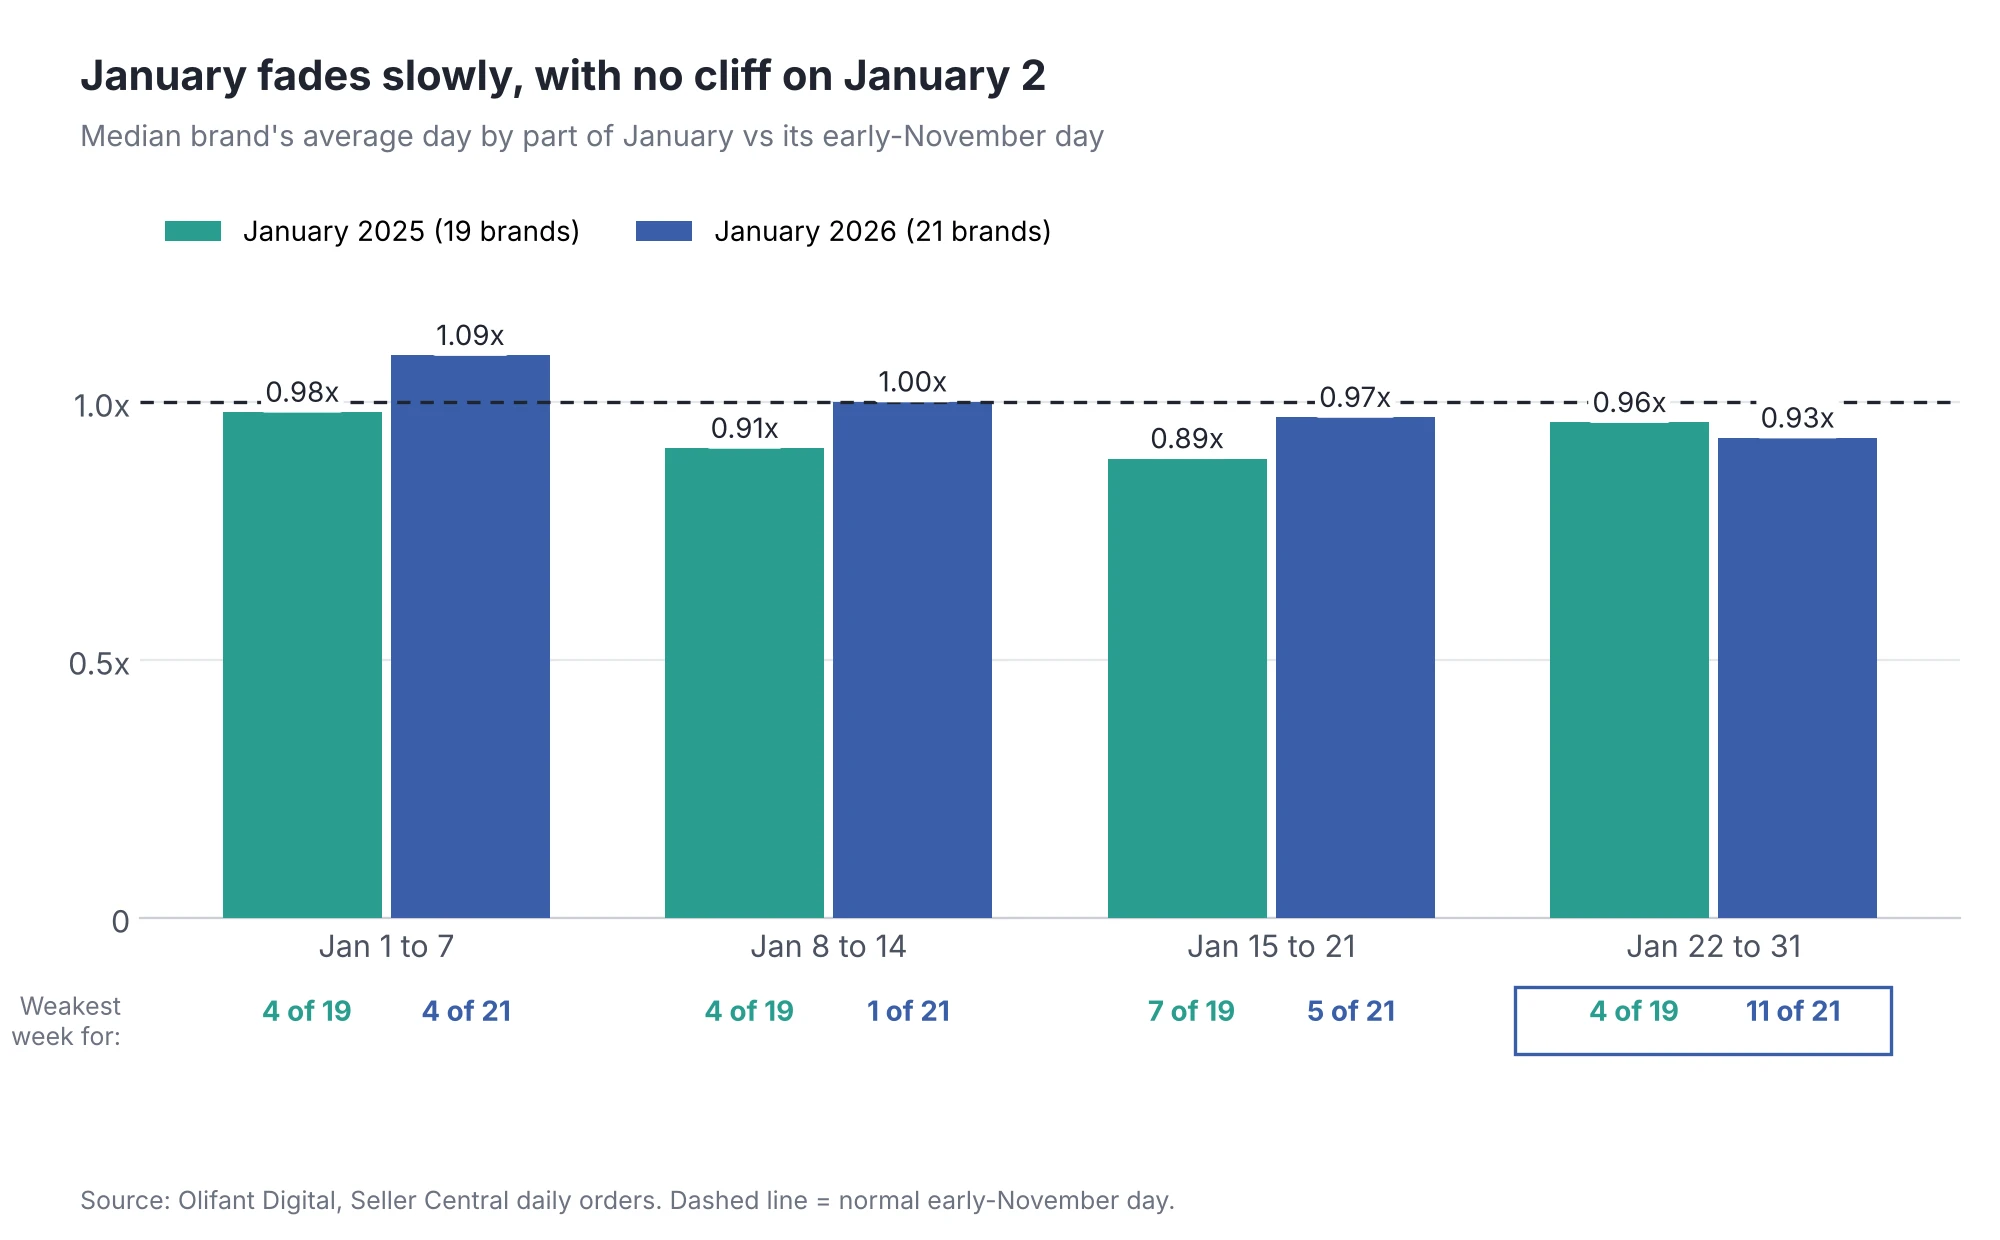
| January week | 2025: average day vs baseline | 2025: weakest week for | 2026: average day vs baseline | 2026: weakest week for |
|---|---|---|---|---|
| Jan 1 to 7 | 0.98x | 4 of 19 | 1.09x | 4 of 21 |
| Jan 8 to 14 | 0.91x | 4 of 19 | 1.00x | 1 of 21 |
| Jan 15 to 21 | 0.89x | 7 of 19 | 0.97x | 5 of 21 |
| Jan 22 to 31 | 0.96x | 4 of 19 | 0.93x | 11 of 21 |
The first week of January is often fine, and people spend their gift cards and rebuy items and start their new-year routines. In 2026, the first week was even above a normal day for the median brand.
After that, the sales slide slowly through the month. In 2026, the last stretch of January was the weakest part for more than half of the brands, while in 2025 the low point came a week earlier, in the third week. What you see in both years is a slow fade, and not a cliff on January 2.
When are Amazon sales back to normal after the holidays?
We counted a brand as “back to normal” once it had two weeks in a row that averaged at least 95% of its early-November baseline, counting from January 1.
| Back to normal (95% of baseline, 2 weeks in a row) | Winter 2024/25 (19 brands) | Winter 2025/26 (21 brands) |
|---|---|---|
| Already there in the first two weeks of January | 8 | 10 |
| By the end of January | 8 | 13 |
| By early March | 11 | 14 |
| By early May | 13 | 17 |
| Not back by early May | 6 | 4 |
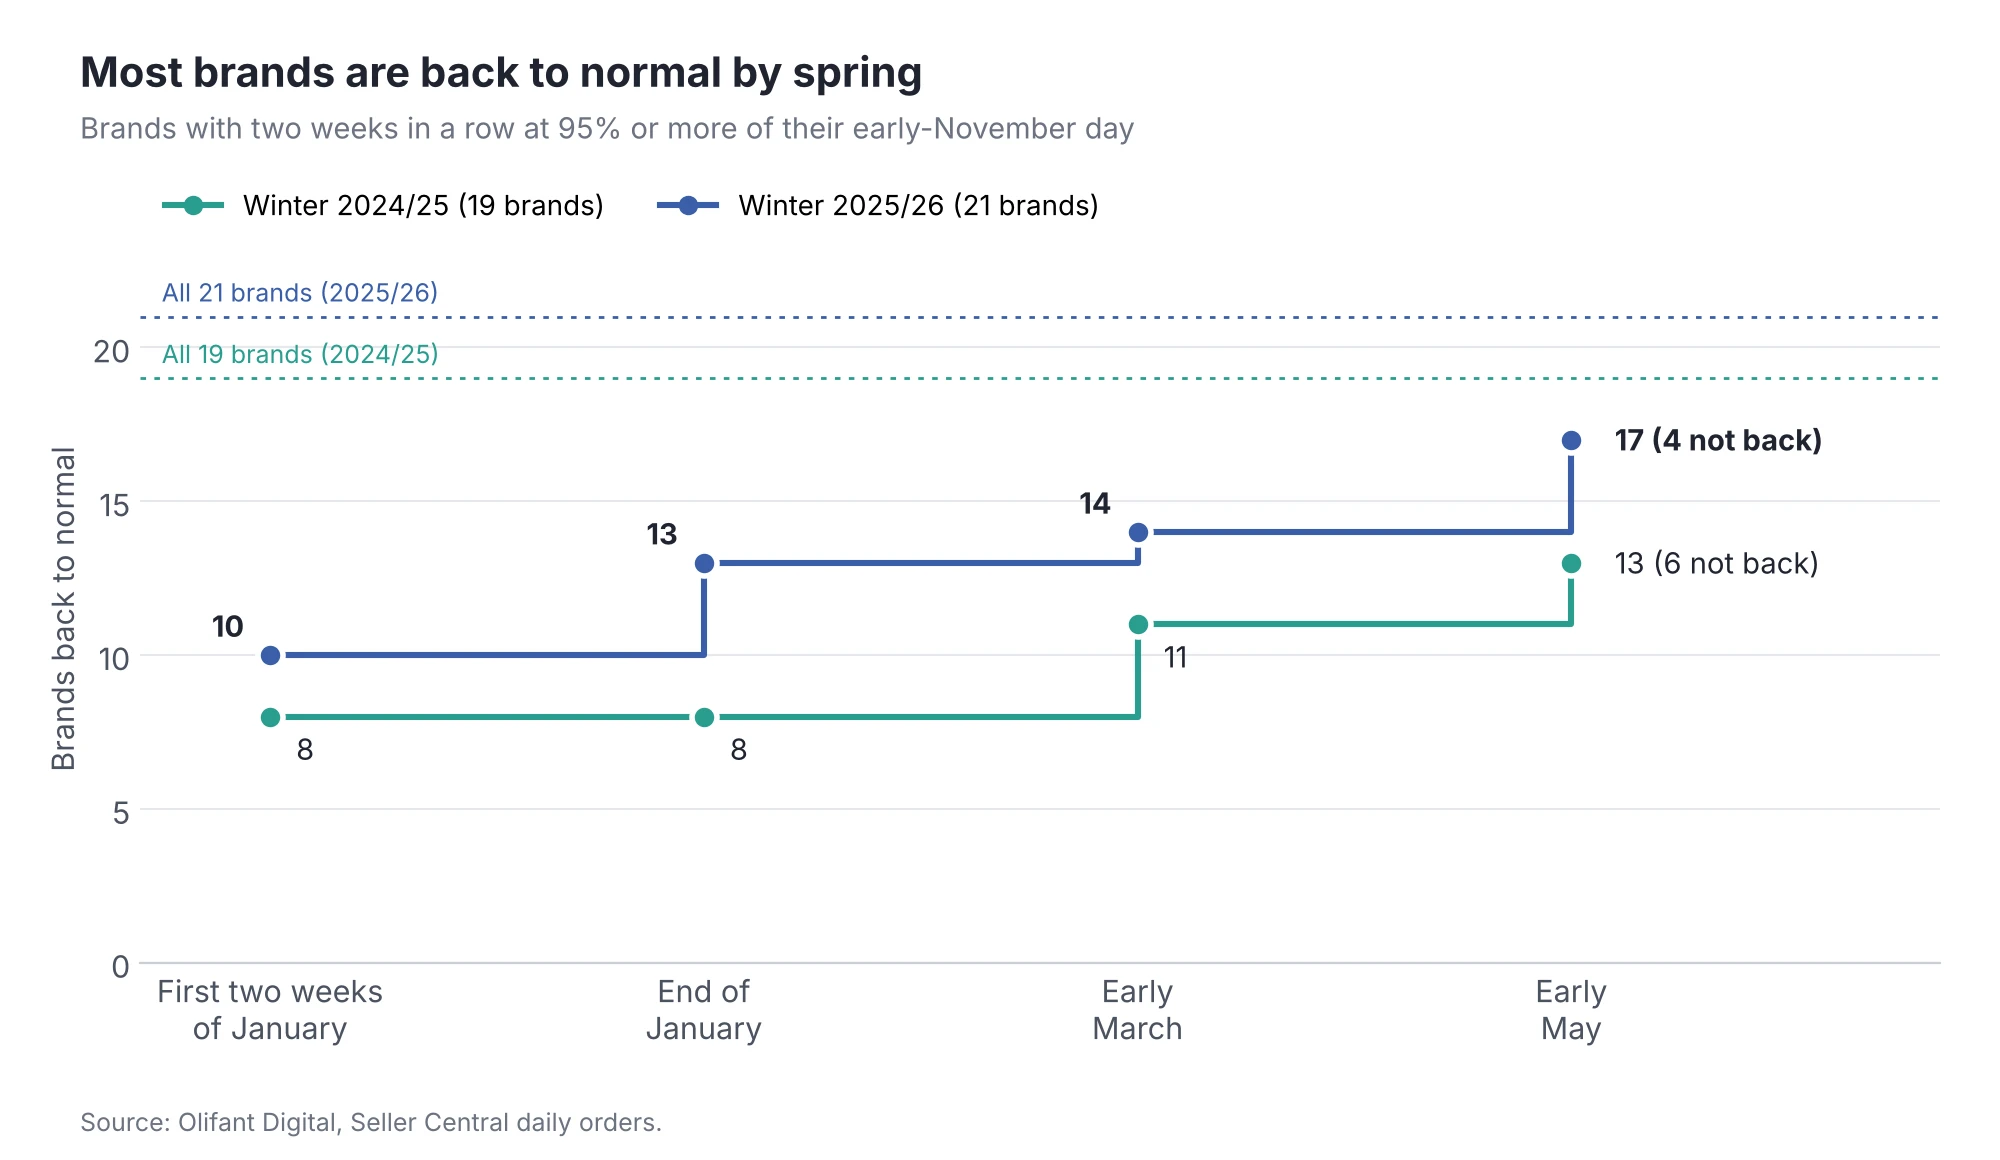
For half of the brands, there was no real slump to recover from in the first place. For most of the others, sales returned by the end of January or during February.
A small group (4 of 21 brands in 2026) stayed below their November level well into spring. For these brands, early November was a seasonal high and not a normal level, so “back to normal” may simply mean a different baseline for them.
Do sales pick up in February and March?
Yes, a little. Here is how February and March compare to each brand’s January sales.
| Compared with January | Winter 2024/25 (19 brands) | Winter 2025/26 (21 brands) |
|---|---|---|
| February average day | 1.05x | 1.01x |
| March average day | 1.09x | 1.07x |
February is roughly flat with January and March is better for most brands. If you are planning your Amazon Q1 sales, a fair working assumption from our accounts is January near your normal level, February about the same, and March a bit higher. We would still check the figures against your own category history before you lock in a plan.
What this means for your brand
You should judge January against a normal month, not December. You should use the first half of November, or a quiet month from earlier in the year as a point of comparison. So this way, you actually avoid cutting your ads too early just because January looks weak next to the holiday season.
Plan for the drop on December 26, not January 1. After Christmas, you should lower your bids and budgets on keywords that people only search for as gifts while keeping the spend on terms they search for all year round. Our Amazon PPC budget allocation guide explains how to move your budget between campaigns.
Pay close attention to the last two weeks of January. This is where most of the brands hit the lowest point in 2026. It is a good moment to make a small coupon or a Subscribe and Save push; however, it is not the right time for a large deal event.
Do not run out of stock after Q4. Many brands sell most of their inventory in December and then have to wait several weeks for the new stock to arrive. Running out of stock in January can hurt your rankings for months, so before you place your orders, you need to read how to manage your Amazon inventory to avoid stockouts and what happens to your rank after a stockout.
Use January to forecast the rest of the year. Since the sales get quieter, January provides time to plan for the months ahead. Our guide to Amazon PPC forecasting walks you right through the process.
Keep in mind that holiday planning starts earlier than you might expect. To see how the November peak builds up, you should read our post on Black Friday and Cyber Monday Amazon ads.
How we collected this data
- Source: Daily Amazon order totals (the sales value of orders placed) from Seller Central for the brands Olifant Digital manages. This includes all orders, both organic and ad-driven.
- Period: November 2024 to May 2025 (winter 2024/25) and November 2025 to May 2026 (winter 2025/26).
- Sample: 19 brands in winter 2024/25 and 21 brands in winter 2025/26. Most of them sell on Amazon US, and a few sell in the UK, Germany or Australia.
- Baseline: Every brand’s average day from November 1 to 14 of the season. Every number is a ratio to that brand’s own baseline, so the brand size and currency don't affect the results.
- Medians, not means: Every figure is the median across brands, so one large brand cannot change the overall result by itself. Where it helps, we also show the middle half of brands (25th to 75th percentile).
- Exclusions: We left out brands with fewer than 14 days of data in the baseline window, more than 3 zero-sales days or a median baseline day under 100 in local currency. This removed 11 brands in 2024/25 and 9 in 2025/26.
- Returns are not included: The data counts orders on the day they are placed. January is a heavy month for returns, so your net sales after returns may look weaker than those numbers.
- Limitations: We only have two winters along with a sample of around 20 brands across different categories. The results describe the brands that we manage, and not all of Amazon. The “weeks” are calendar blocks in January, not Monday-to-Sunday weeks.
Frequently asked questions
How much do Amazon sales drop in January?
You should pick a two-week period before any big sales event, such as the first half of November, and work out your average sales per day for that period. Then, you should take the average January day and divide it by that number. A result that is close to 1.0 means that January is about normal for your brand, even if it looks lower than December.
Should I pause my Amazon ads in January?
In most of the accounts that we manage, pausing everything does more harm than good.
Your brand campaigns and the keywords that people search for all year still bring in steady sales after the holidays. The campaigns worth cutting back are the ones built around gift searches, because this demand ends quickly after Christmas.
What should I do if my January sales are below my normal level?
You should start by checking whether you ran low on stock in December. Even short stockouts can push your products down in search results. If the stock was fine, you should compare January with a quiet month from earlier in the year as well.
For some brands, early November is already a busy season, and this makes January look weaker than it really is.
Is January a good time to launch a new product on Amazon?
If you plan it well, January can be a good time to launch. Without the holiday rush, your team has more time to watch the launch closely and adjust your ads. A January launch also gives the product a few months to collect reviews before the spring season starts.
Do these numbers include returns?
No, they don’t, because we counted each order on the day it was placed. Many returns from holiday gifts happen in January, so your net sales for the month may come in a little lower than what this study shows.
Read January against a normal month
A January report can look worrying when you only compare it with December, but it often tells a very different story once you put it next to a normal month. If you want help reading your numbers and planning your Q1, our team at Olifant Digital can put together a free marketing plan built around your brand.

Alex is the founder and CEO of Olifant Digital, where his team manages over $100M in annual client revenue across 50+ brands on Amazon and ecommerce. He sets the agency's strategy and methodology, audits client accounts, and reviews the team's work to make sure every brand is on track to hit its growth and profitability goals. He also leads team training, so the performance data and lessons from across all accounts shape how every account manager runs their clients.



Mike reviews every Amazon article on this blog for strategic and technical accuracy before it publishes. As Director of Amazon Growth at Olifant Digital, he sets marketing strategy across client accounts and personally audits PPC at every stage of growth. He brings 8 years of daily Amazon operations across 7 and 8-figure brands including Beauty by Earth, Ekster, and Bullstrap, the kind of hands-on depth most agency directors delegate away.