Introduction
Most Amazon sellers are already aware that some months are busier than others; however, few know how much. This is an important gap, because every decision you make going forward depends on it, from how much stock you order to when and how you spread your ad budget and launch new products.
The usual advice is to plan for Q4, which is not wrong, but it overlooks the other nine months, when most of your sales occur. It also assumes every brand peaks at the same time, which is not always true.
To get a clear picture, we took the daily Seller Central orders for 20 brands that we manage at Olifant Digital and we added them up into calendar months. We counted all of the orders, and not just those that came directly from ads. Our main year runs from October 2025 to September 2026, and we checked it against November 2024 to September 2025 to make sure all of the patterns held up.
In this study, you will see which months sell the most and least, how big the gap between them really is, what Prime Day and the October deal event did to sales, and whether or not people spend more per order during the holidays.
Key findings
December was the strongest month of the year. The median brand sold 1.29x its average month in December and 1.22x in November.
At the other end of the year, February was the weakest month at 0.89x, and April (0.90x) and June and July (both 0.91x) were not far behind it.
Q4 made about 31% of the year, which is 6 points more than the 25% you would get if every quarter were the same. For the middle half of the brands, the Q4 share landed somewhere between 23% and 33%.
Prime Day did not give July a reliable lift. In 2025, July beat the average of June and August by 4%, but in 2026, when Prime Day moved to June, July was 9% lower, and only 5 of the 20 brands saw July beat its neighbors.
The amount people spend per order hardly moved at all. The average order value stayed within about 2% of normal in every month, so the busy season is really about more orders and not bigger baskets.
What are the best and worst months to sell on Amazon?
To compare brands of different sizes, we measured all of their monthly sales against their own average month, so when you see a month that shows 1.29x, it means that the brand sold 29% more that month than it does in an average month.
After this step, we took the median across all 20 brands for every calendar month, and by doing this, a large brand and a small brand count the same, and one big account cannot pull the result in its direction.
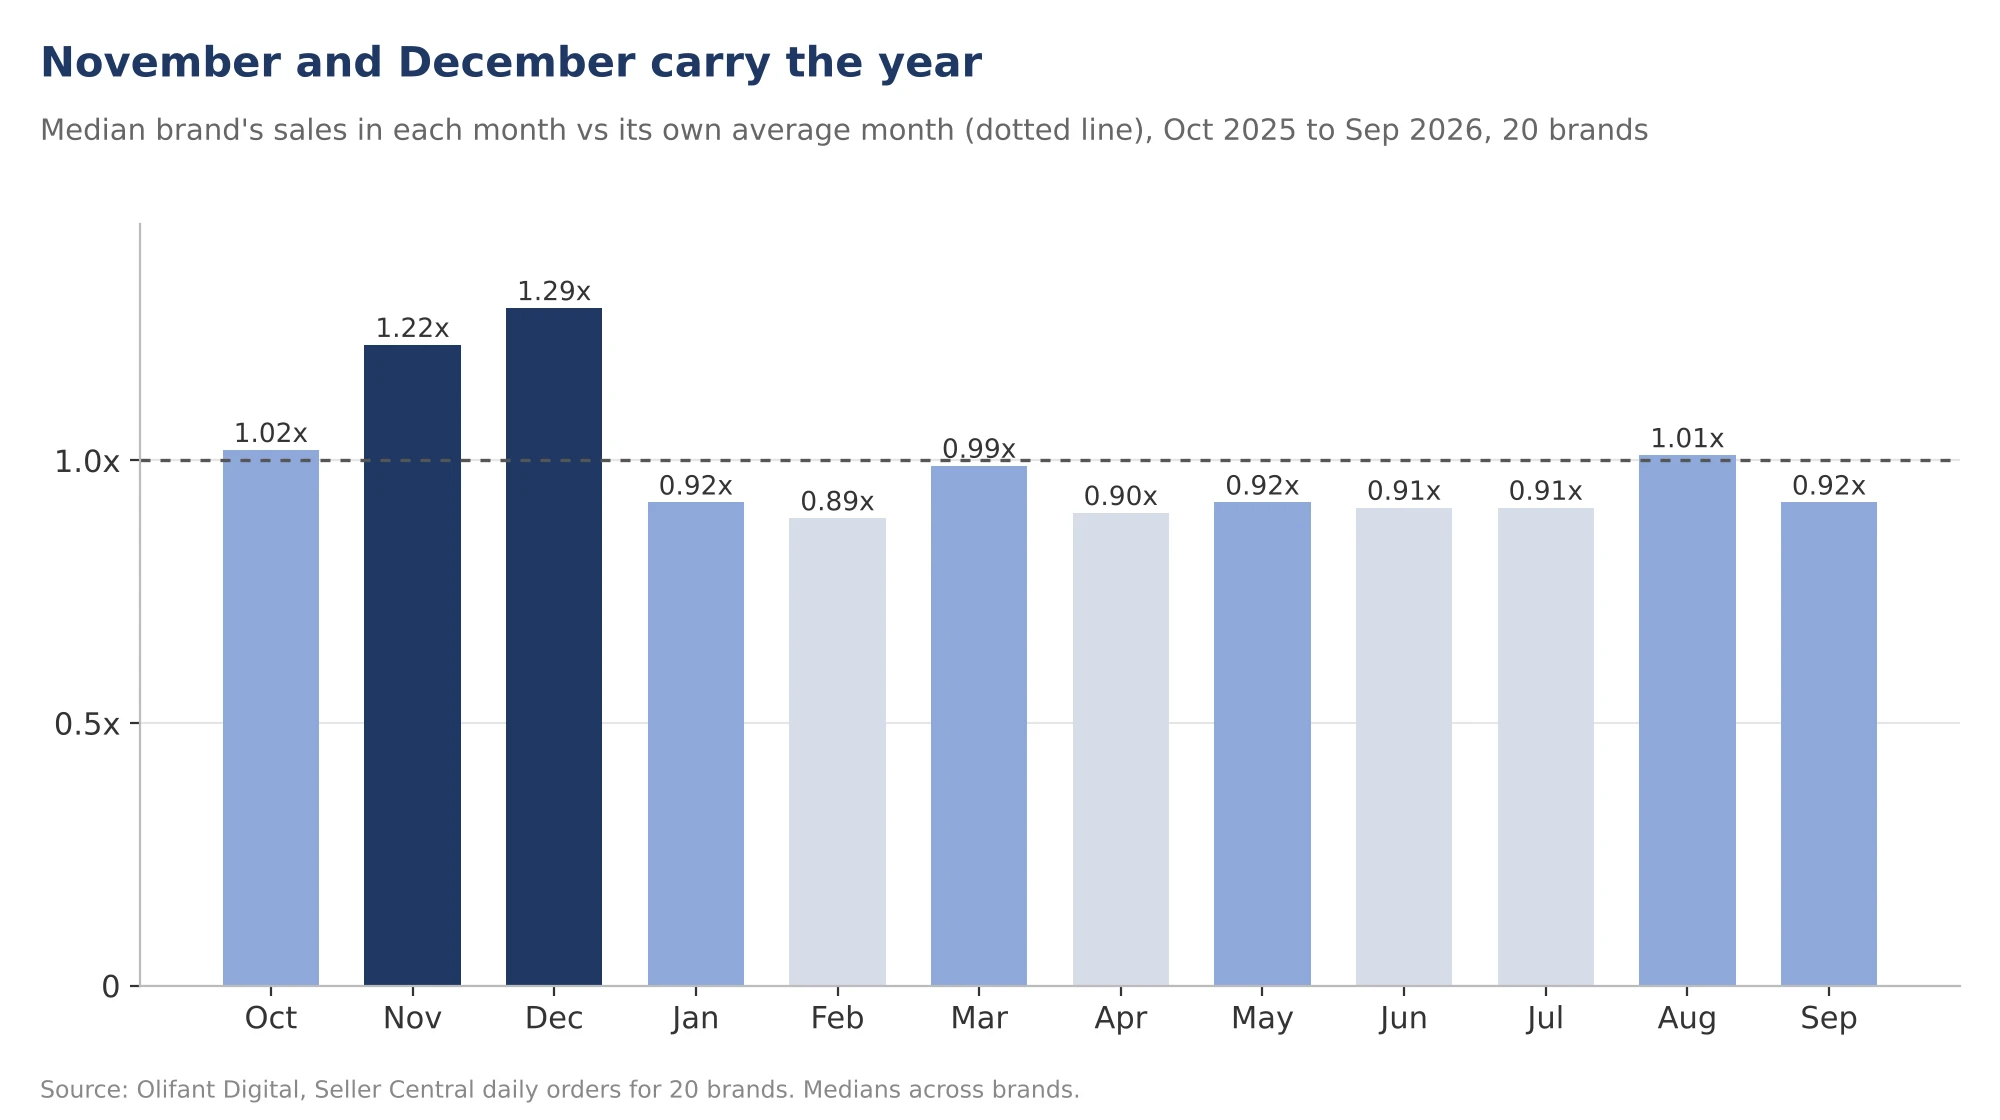
Amazon sales by month, median brand (20 brands, October 2025 to September 2026)
| Month | Median index | Middle half of brands | Brands above their average |
|---|---|---|---|
| January | 0.92x | 0.68x to 1.06x | 9 of 20 |
| February | 0.89x | 0.75x to 0.97x | 3 of 20 |
| March | 0.99x | 0.87x to 1.12x | 9 of 20 |
| April | 0.90x | 0.74x to 0.96x | 3 of 20 |
| May | 0.92x | 0.72x to 1.02x | 6 of 20 |
| June | 0.91x | 0.80x to 1.04x | 6 of 20 |
| July | 0.91x | 0.70x to 1.09x | 7 of 20 |
| August | 1.01x | 0.76x to 1.13x | 10 of 20 |
| September | 0.92x | 0.68x to 1.05x | 6 of 20 |
| October | 1.02x | 0.77x to 1.23x | 11 of 20 |
| November | 1.22x | 0.90x to 1.46x | 13 of 20 |
| December | 1.29x | 0.94x to 1.53x | 13 of 20 |
What I am sure you notice first is that only November and December sit clearly above the average for most of the brands. Most of the other ten months come under 1.00x, and this is because the holiday peak pulls the yearly average up for everything else.
The second thing is how soft February and April are. In those months, only 3 of 20 brands managed to beat their own average. February also has fewer days than the other months, which explains part of the dip.
When we looked at the earlier year, from November 2024 to September 2025, the story was similar. November (1.11x) and December (1.04x) were again the top months, while February (0.83x) was again the lowest and April (0.87x) came right after it.
How big is the gap between your best and worst month?
For the median brand, the best month sold 2.57 times as much as the worst month in the same year. That is a big swing, and you need to plan your stock and cash around it well in advance.
Not every brand peaked at the same time, though.
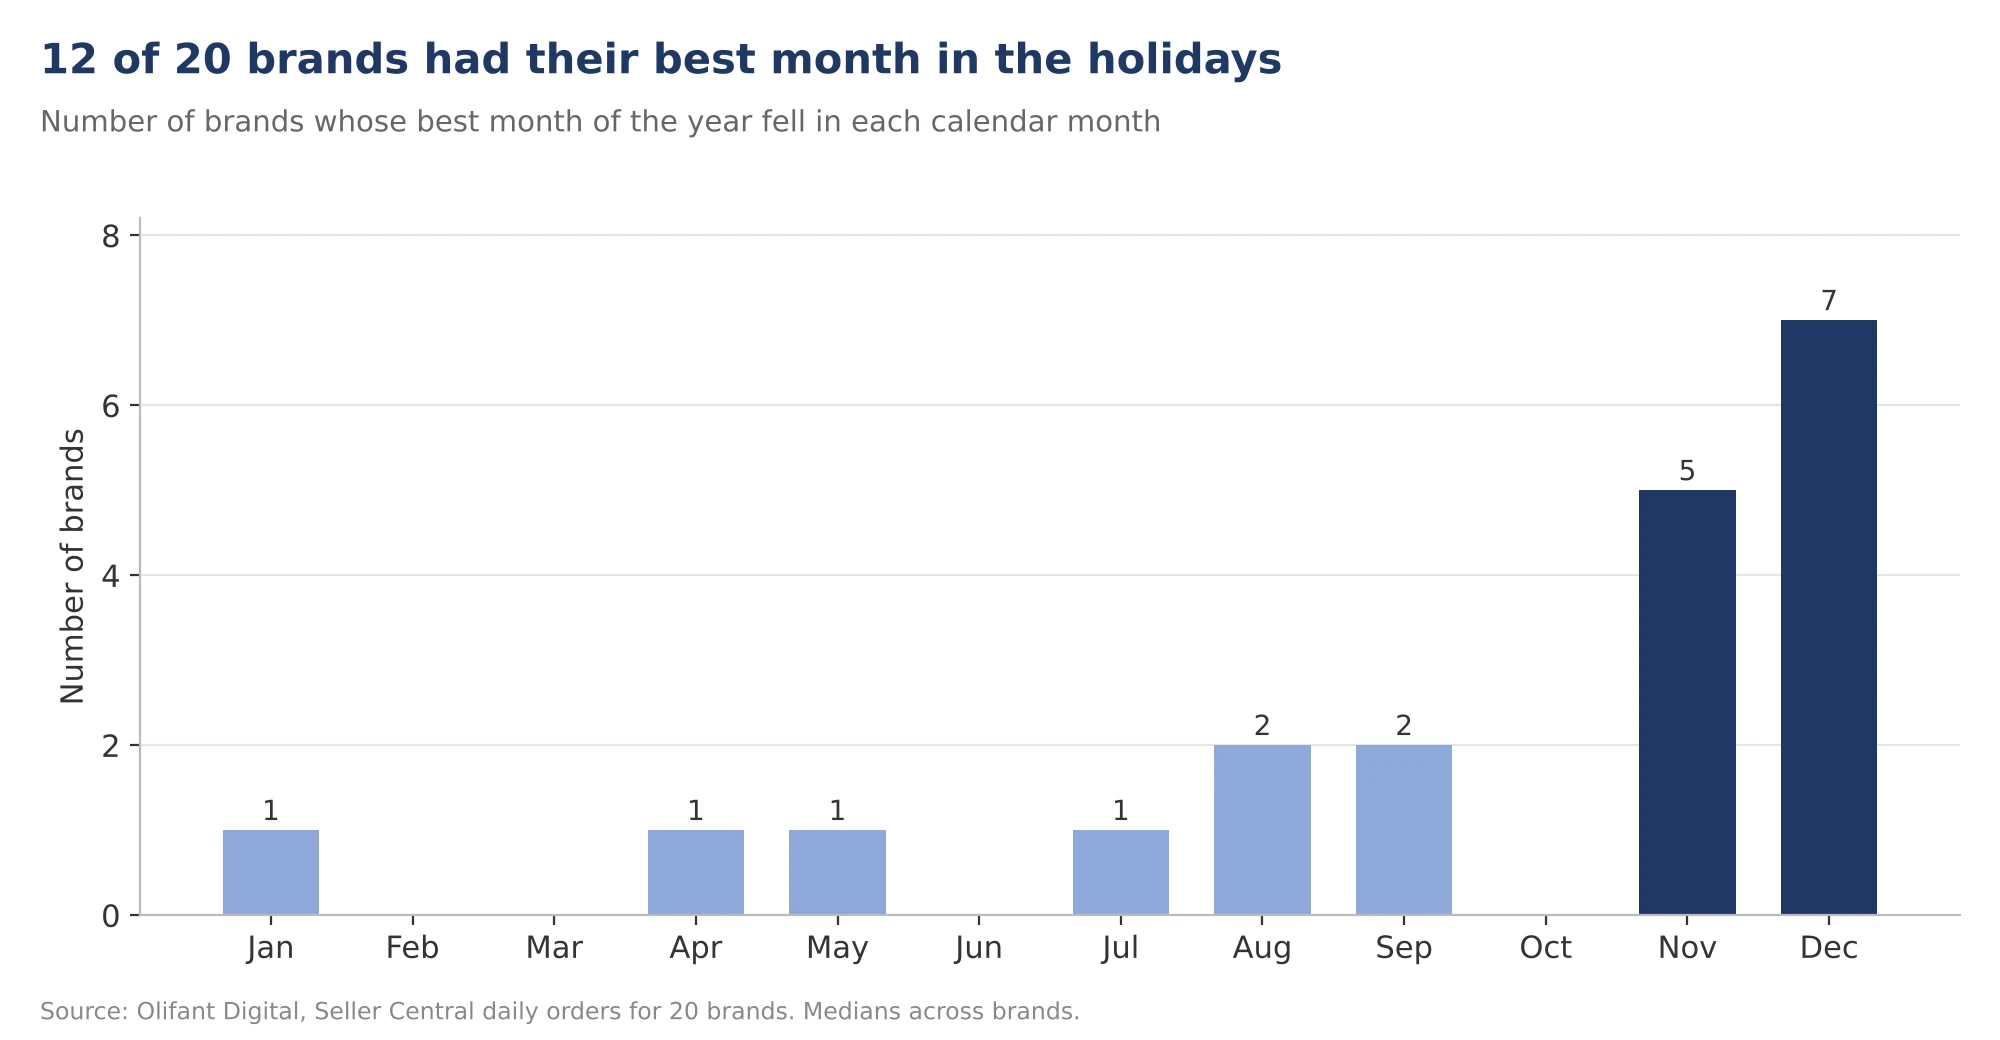
December was the top month for 7 of the 20 brands and November was the top month for 5, so 12 of the 20 brands had their best month in the holiday season. The other 8 peaked in August, September, January, April, May or July, and these tend to be brands with a strong season of their own, like outdoor, sports, or gifts for a spring holiday.
The worst month was spread out even more. Across the 20 brands, it landed in 11 different months. So while most brands share the same best season, there is no single month that is bad for everyone.
What share of yearly Amazon sales comes in Q4?
For the median brand, October to December made 31% of the yearly sales. If sales were completely flat across the year, those three months would account for 25%. For the middle half of the brands, the Q4 share was between 23% and 33%, and 12 of the 20 brands made more than a quarter of their year in Q4.
The first half of the year, from January to June, made about 45% for the median brand, which means the second half, with the holidays in it, is more important.
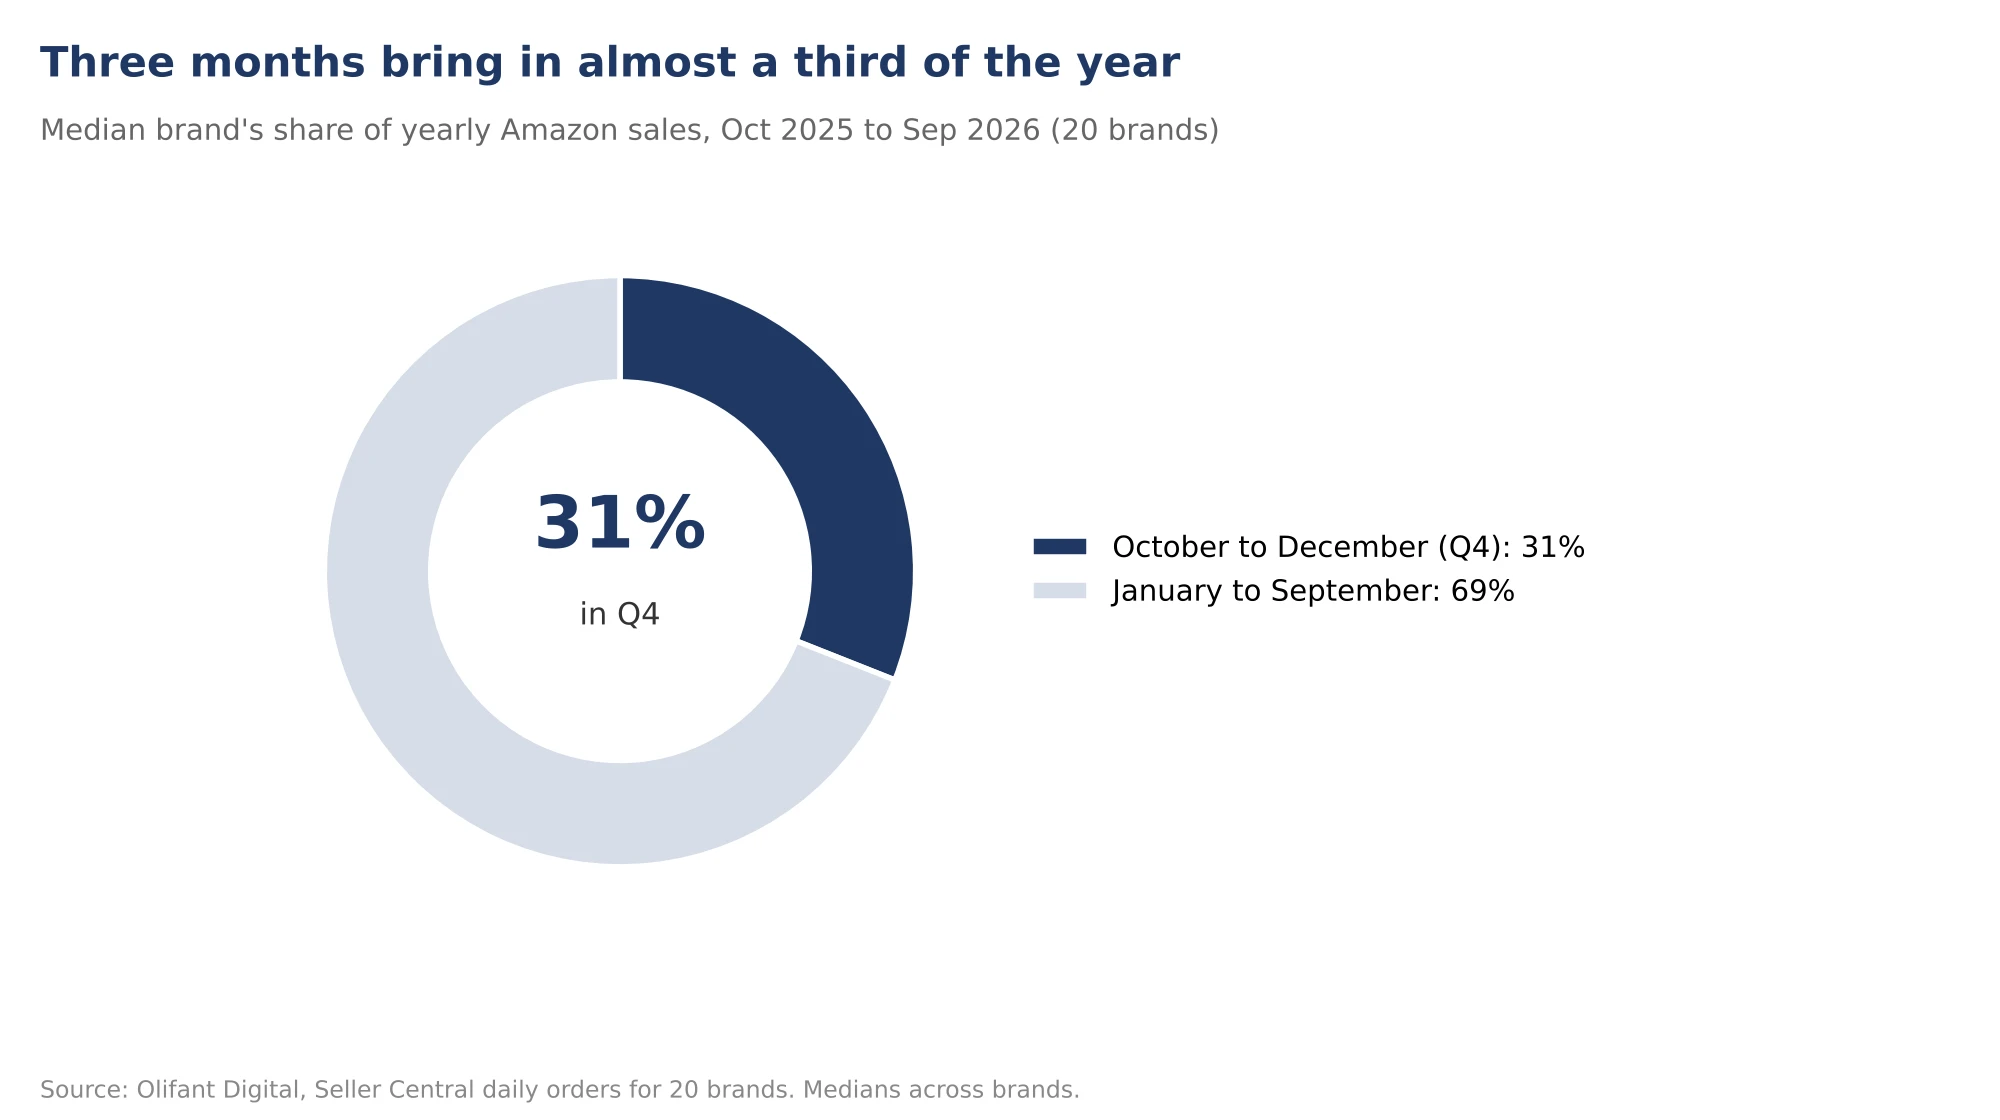
Q4 matters a lot, but it is not the whole year. Roughly 69% of sales still come in from January to September, and a brand that only pays close attention during the holidays is leaving most of its revenue without much of a plan behind it.
If you want a step-by-step plan for the holiday months, our Amazon Q4 and BFCM prep checklist walks you through it.
Does Prime Day make July a big month?
Not necessarily. To check it, we compared July with the average of June and August for each brand.
July vs the average of June and August (20 brands)
| Year | Median July lift | Brands where July beat its neighbors |
|---|---|---|
| 2025 | 1.04x | 11 of 20 |
| 2026 | 0.91x | 5 of 20 |
In 2025, July came in 4% above its neighbors for the median brand. In 2026, it came in 9% below them.
The biggest reason is the calendar. Prime Day 2025 ran from July 8 to 11, so the whole event was in July. In 2026, Amazon moved Prime Day to June 23 to 26, which meant the deal days counted toward June, and July was then being compared with a June that already had Prime Day in it.
There is also a simpler reason. Prime Day lifts a handful of days and not a whole month, and a strong deal week can easily be followed by a few quiet weeks once it is over.
What this approach means in practice is that you should plan Prime Day as an event and not as a month. Judge it on the deal days and the week that follows, and do not expect July as a whole to carry your summer.
How much does the October deal event lift sales?
Only a little. Amazon’s October deal event, Prime Big Deal Days, ran in early October 2025. For the median brand, October 2025 sold 1.04x September 2025, and 11 of the 20 brands grew from September to October.
Now compare that with the holiday months. November 2025 came in at 1.21x September for the median brand, and December came in at 1.21x as well. October works more like a warm-up than a peak, and in the full-year index it came in at 1.02x, right around an average month.
If you are trying to decide how to split your money between the October event and Black Friday, read our post on Prime Big Deal Days vs Black Friday and how to split your budget.
Does average order value change by month?
Hardly at all. We measured each brand’s average order value (its sales divided by its orders) against its own yearly average, and then took the median for each month.
Average order value by month, median brand (20 brands, October 2025 to September 2026)
| Month | Average order value index |
|---|---|
| January | 0.99x |
| February | 1.01x |
| March | 0.99x |
| April | 1.02x |
| May | 1.02x |
| June | 0.99x |
| July | 1.01x |
| August | 0.99x |
| September | 1.00x |
| October | 1.00x |
| November | 0.99x |
| December | 0.99x |
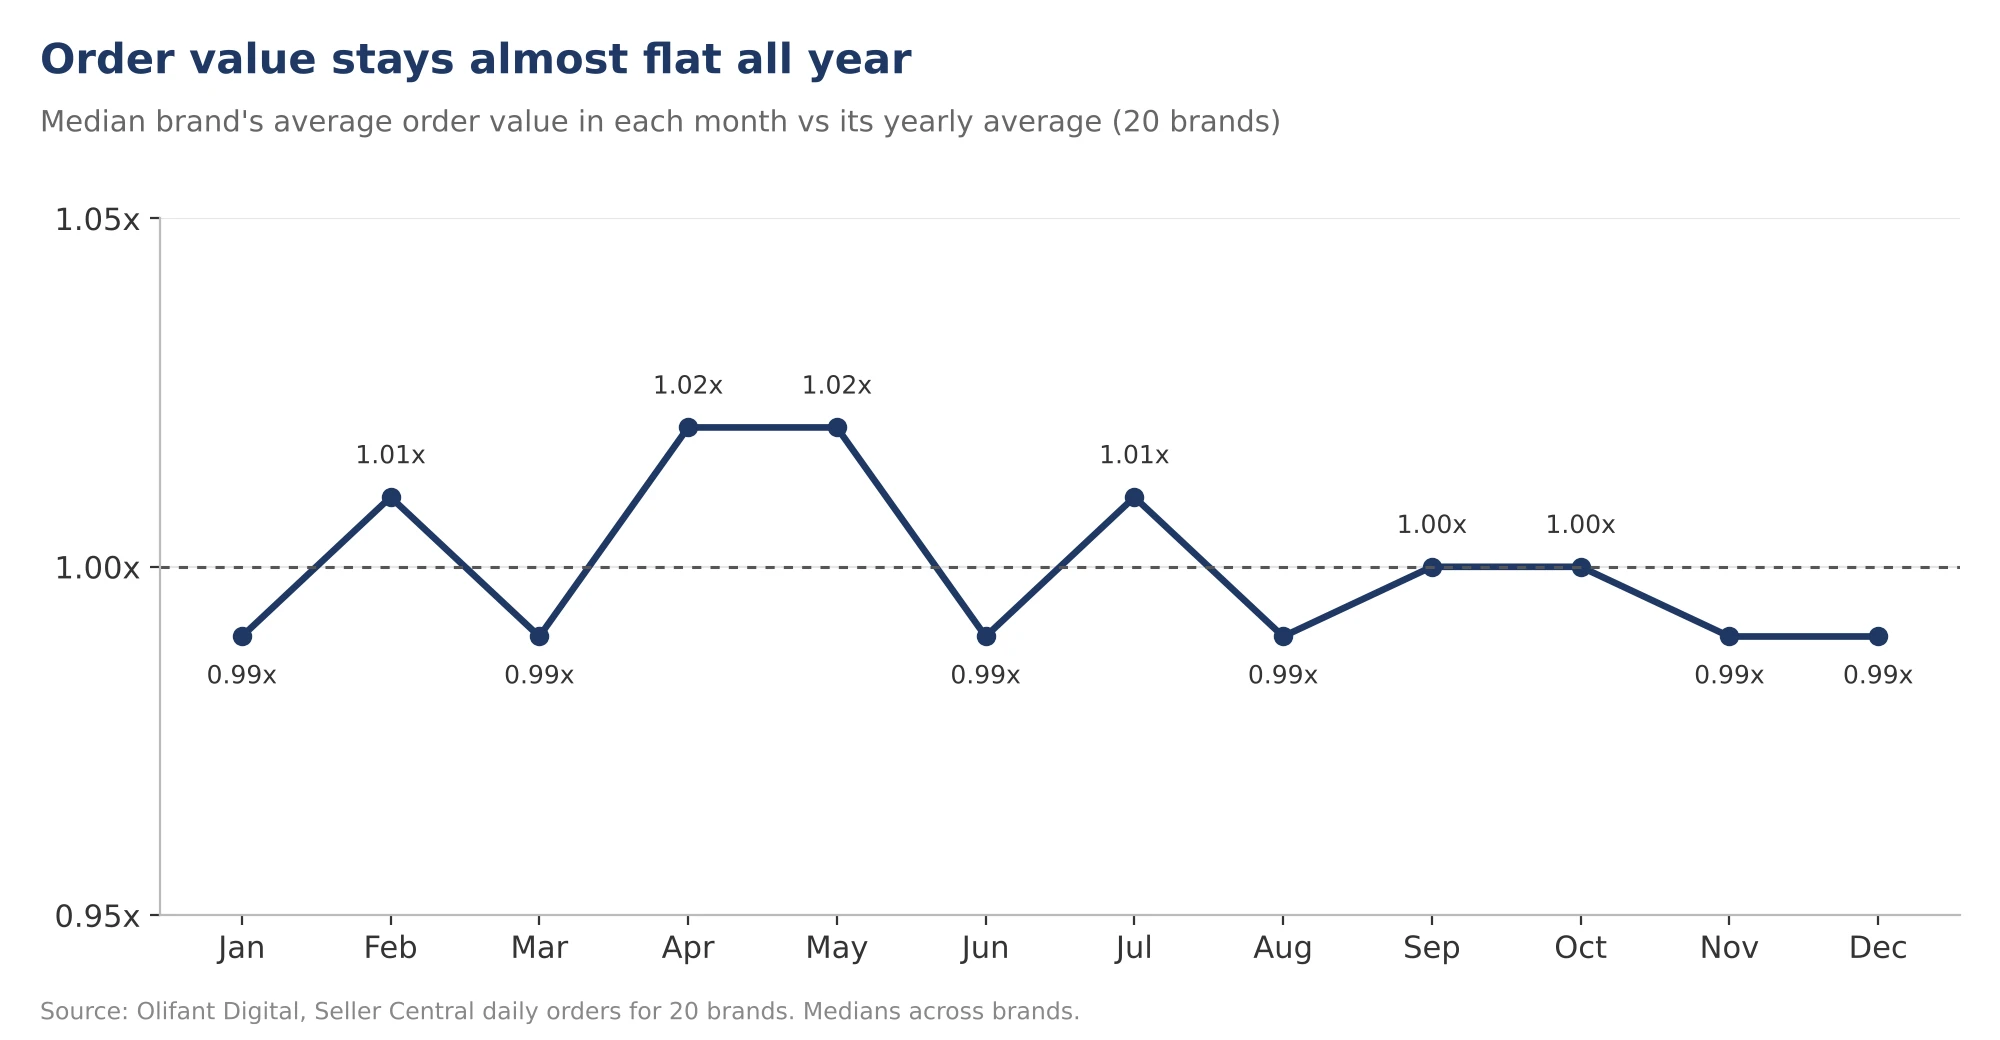
Every single month stays within 2% of normal. December is a touch lower at 0.99x, likely because of holiday discounts, and spring is a touch higher, with April and May both at 1.02x.
So the holiday peak comes from more people ordering and not from people spending more on each order.
If you want to raise your order value, it takes deliberate work, such as bundles and multi-packs, rather than waiting for the season to do it for you. Our guide on how to increase average order value on Amazon covers the options.
How should you plan your year around these months?
This is how our team uses this calendar when we plan the year with the brands we manage.
1. Order your holiday stock early
November and December together sold about 2.5 average months for the median brand, so if your stock is sized for a normal month, you are going to run short.
Running out in Q4 also hurts your ranking going into January, so take a look at how to manage Amazon inventory to avoid stockouts and why rank drops after a stockout.
2. Move your ad budget with demand instead of spreading it evenly
Spending the same amount every month means you spend too little when shoppers are ready to buy and too much when they are not. Our post on Amazon PPC budget allocation explains how to weight it.
3. Use the quiet months to build
February and April are soft for most brands, and that makes them good months to test new listings, images and campaigns.
They are also a good time to launch new products so that by the time Q4 arrives, those products already have reviews and some ranking behind them.
4. Check your own sales curve before anything else
8 of the 20 brands peaked outside the holidays. If you sell a seasonal product, your own two years of history will tell you more than any median, so use this data as a check and then build your forecast from your numbers.
Our Amazon PPC forecasting guide shows you how to do this.
5. Treat Prime Day as a few days, not a month
July was not a reliably big month in our data. This is why you should plan your deals, stock and budget for the event week itself and judge the results on those days.
How we collected this data
Everything in this study comes from the daily Amazon order data in Seller Central (sales, orders and units) for the brands that we manage at Olifant Digital.
We included all orders, not just the ones that came from ads, and we added the days up into calendar months.
Our data starts in late October 2024, so October 2024 was incomplete and we left it out. October 2026 is also incomplete, so it was left out as well. That gives us a main year from October 2025 to September 2026 with 12 complete months and a check year from November 2024 to September 2025 with 11 complete months.
The sample is 20 brands. 16 of them sell in the US, and there is one each in Canada, the UK, Germany and Australia. The categories include home and furniture, pet care, supplements, beauty, golf, food and outdoor.
To be included, a brand needed at least 20 orders in every one of the 23 complete months. We dropped 10 seller accounts because they were new, paused, or too small to give a stable monthly pattern.
We measured each month against the brand’s own average month in the same year, so currency and brand size do not affect the results. Every figure is a median across the brands, and the ranges show the middle half of the brands.
There are a few limits worth knowing about, though. 20 brands is a useful sample, but it is not the whole market.
Brands that grew or shrank during the year show a trend on top of the season, and our method does not remove that. The sales also include the effect of our own promotions and ad changes, and Prime Day and the October event fall on different dates each year.
You can find more of our data studies on our research page.
Frequently asked questions
Should I raise my prices during the holiday months?
In most cases, we would leave them where they are. Shoppers in November and December are comparing deals more closely than at any other time of the year, so a higher price tends to cost you more in lost sales than it adds to each order.
If your goal is to earn more per order in the busy months, a bundle usually does that job better than a price increase.
How does seasonality affect my cash flow?
The tricky part is the timing. You pay for your holiday stock and your extra ad spend weeks or even months before the holiday sales actually come in, so the tightest point for your cash is often late summer and early autumn, right before the busy season starts.
It helps to plan that gap into your budget early so that a slow spring does not leave you short when it is time to place your holiday orders.
Is it worth running deals in the slow months?
It can be, as long as the deal has a clear purpose. A quiet month is a good time to clear older stock you do not want to carry into the next season or to help a newer product get its first sales and reviews.
What we would avoid is a deep discount that only exists to make a slow month look better on the report, because the sales usually fall straight back once the deal ends.
Do busy months make it harder to hold my organic ranking?
They can. When the whole category is selling more, competing brands are pushing harder too, and positions in the search results move around much faster than usual.
Brands that keep their ads and stock steady through the peak usually find it easier to hold their place in the quieter months that follow.
How often should I update my seasonal plan?
We would go through it properly once a quarter, and again right after every big event, like Prime Day or Black Friday.
Each of those events tells you something new about how your own brand reacts, and a plan written in January rarely makes it through the whole year without changes.
Build next year’s plan around your own calendar
Every brand’s calendar is a little different, so if you would like a stock, budget and launch plan built on your own sales history, you can get a free marketing plan from Olifant Digital, and our team will put it together around the months that matter most for your brand.

Alex is the founder and CEO of Olifant Digital, where his team manages over $100M in annual client revenue across 50+ brands on Amazon and ecommerce. He sets the agency's strategy and methodology, audits client accounts, and reviews the team's work to make sure every brand is on track to hit its growth and profitability goals. He also leads team training, so the performance data and lessons from across all accounts shape how every account manager runs their clients.



Mike reviews every Amazon article on this blog for strategic and technical accuracy before it publishes. As Director of Amazon Growth at Olifant Digital, he sets marketing strategy across client accounts and personally audits PPC at every stage of growth. He brings 8 years of daily Amazon operations across 7 and 8-figure brands including Beauty by Earth, Ekster, and Bullstrap, the kind of hands-on depth most agency directors delegate away.