


.png)

.svg)
Introduction
What Is Amazon PPC Management?
Amazon PPC management is the discipline of structuring, optimizing, and continuously refining Amazon's pay-per-click campaigns to drive profitable revenue at a defined ACoS or TACoS target. It includes commercial-objective alignment, campaign architecture, keyword strategy, bid optimization, listing-PPC integration and optimization (ideally daily). It matters because strong PPC management lets you seize ranking opportunities, improve organic rank, and scale profitably. It protects your margin from wasted spend and rising TACoS on an otherwise healthy Amazon business.
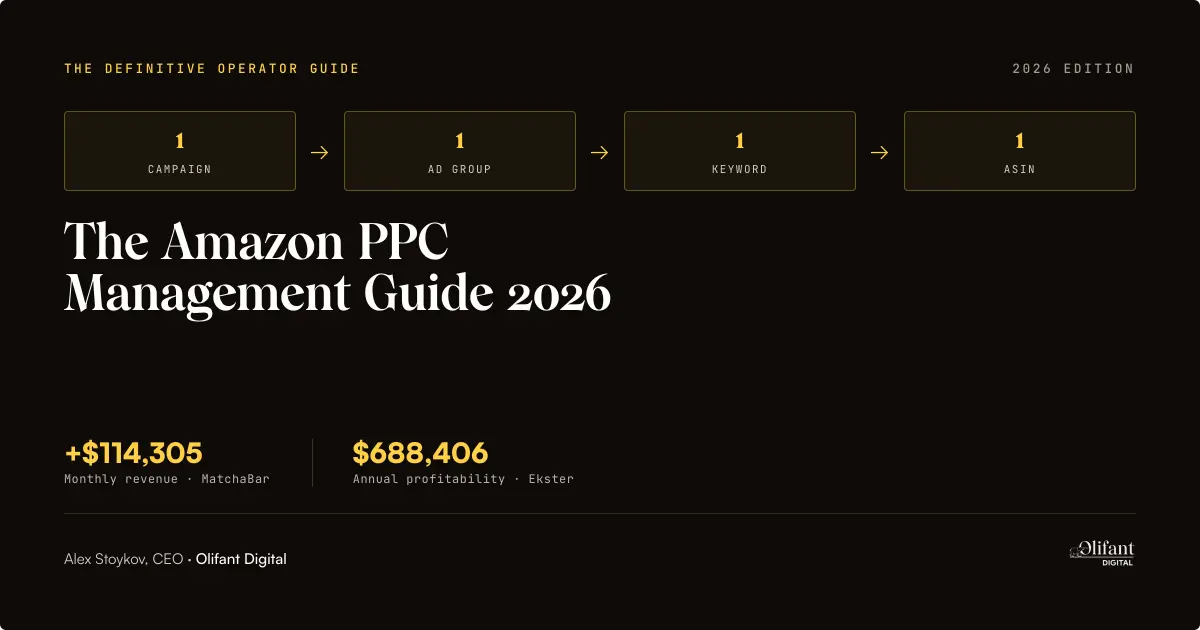
I'm Alex Stoykov, CEO of Olifant Digital. We manage over $100M in annual client revenue on Amazon and deploy millions in Amazon Ads every year — across 50+ active brand accounts in the US, Canada, UK, and Europe. This guide is the operator-grade reference we wish had existed when we started managing 7 and 8-figure Amazon brands. It covers the 1-1-1-1 Scaling Method, the commercial-objectives framework that determines your ACoS tolerance, the math behind every bid decision, the underrated formats most agencies miss, and the 2026 platform changes that have reshaped how Amazon PPC actually works.
Who This Guide Is For (and How to Read It)
⭐IMAGE 3: Reader personas infographic
The Olifant Approach: Two Lenses That Drive Every PPC Decision
Lens 1: Marketing strategy
Lens 1 is the strategic layer. Before adjusting a single bid, Olifant Digital first defines the brand’s commercial objective and marketing strategy for the next 90 days (e.g., launch velocity, ranking defence, profit maximization, market share capture, or stock clearance.
This is used to set the advertising cost of sales (ACoS) tolerance band. In other words, how much ad spend as a percentage of revenue is acceptable for this account right now.
The ACoS tolerance band, in return, dictates the bid strategy. Whether to use aggressive dynamic bidding, fixed bids, or a conservative down-only approach rests on this number. This sequence ensures that bid decisions are connected to business goals.
Lens 2: The 1-1-1-1 Scaling Method (execution framework)
The 1-1-1-1 Scaling Method is Olifant Digital's proprietary Amazon PPC framework: one campaign, one ad group, one keyword, one ASIN. Each combination operates as an isolated unit.
When a campaign contains 20 keywords, only few may deliver a high return on ad spend (ROAS) while receiving only a limited share of ad spend. This approach identifies those high-performing keywords and reallocates budget toward the strongest targets, ensuring more ad spend is directed to those winning keywords most likely to drive profitable growth.
⭐ Image 4: 1-1-1-1 Scaling Method diagram
When NOT to use 1-1-1-1
While the 1-1-1-1 Scaling Method has achieved great results time and time again, it’s not recommended for discovery campaigns (auto and broad match) as well as brand defense campaigns.
Discovery campaigns are designed to find converting search terms and require adding negative keywords constantly. With brand defense campaigns, you often need to showcase multiple ASINs to cover its full value and leverage cross-selling. These are impossible to do with only one ad group or ASIN.
Want to apply the 1-1-1-1 Scaling Method to your own account? The naming convention template gives you 50 example campaign names across the five commercial objectives, four ad types, and three match types.
What most agencies get wrong (and how Olifant Digital does it differently)
Most agencies price a retainer without first defining clear goals. They optimize the ad account without knowing which product(s) should be kept at 25% ACoS and which ones are fine with 50+% ACoS. For example, if the goal is launch velocity, a break-even ACoS can be anything from 30% to 80% for the first 60 to 90 days.
Here’s how Olifant Digital approaches it differently:
Every brand Olifant Digital takes on starts with goal setting. We don’t quote an ACoS target until we understand the brand’s goals for the next 90 days. Only once we’re on the same page as to what the goals are do we define the marketing strategy.
⭐ Image 5: Common architecture mistake vs 1-1-1-1 (side-by-side comparison)
Case study: How the 1-1-1-1 Scaling Method produced $114,305 for MatchaBar
To get a better understanding of the 1-1-1-1 Scaling Method, you can refer to the MatchaBar case study. The beverage brand lacked a unified growth strategy which meant that its ad budget was wasted on poor product listings and surface-level PPC strategies.
As such, Olifant Digital rebuilt every campaign by ensuring each campaign focused on one ad group, one keyword, and one ASIN only. This strategic PPC rebuild was combined with weekly testing and optimization to double down on what delivered results and further reduce spending on ASINs, keywords, and ad groups that didn’t.
With complete visibility into performance, the team could improve conversion rates (CVRs), ACoS, and total advertising cost of sales (TACoS). These improvements added up to an extra $114,305 in monthly revenue.
The Five Business Goals and Their ACoS Tolerance
Your goal will ultimately determine how much ACoS you can rationally afford to spend. The following are the five objectives across the lifecycle of an Amazon product. Each has a specific ACoS it can safely tolerate to ensure optimal investment during critical moments and prevent profit erosion once you enter stability.
⭐ Image 6: Commercial objectives ACoS tolerance matrix
Launch velocity — when you’re buying visibility
Launch velocity is focused on reducing the time needed for a product to achieve ranking and category relevance on Amazon. In short, the goal is accelerated market penetration.
It’s a common marketing strategy among sophisticated operators because Amazon’s ranking system rewards momentum. Products that get sales quickly across relevant search terms tend to achieve stronger organic positioning compared to those that grow slowly over a longer period.
Specific scenarios that call for launch velocity include:
- New product launches in competitive categories
- Seasonal products with narrow demand windows
Ranking defense — when you’re protecting share of voice
Ranking defense helps protect your existing keyword dominance and category visibility. Unlike launch velocity where the goal is aggressive growth, the objective of ranking defense is to maintain ownership of the demand you already created or currently control. As such, it’s more commonly used by established Amazon brands that enjoy a meaningful organic rank, branded search volume, and category dominance.
Specific scenarios that call for launch velocity include when:
- ASINs are organically ranking in the first five spots for critical keywords (e.g., a kitchen brand ranking #1 for “milk forther”).
- Competitors are beginning to target your brand aggressively.
- Peak season, Prime Day, or a major promotional window (e.g., Christmas) is approaching.
Profit maximization — when margin is sacred
When you set profit maximization as your commercial goal, you’re setting up your PPC strategy so that it generates the highest possible profit. As such, you’ll use contribution margin per unit, instead of conversion rate or top-line revenue, as your primary metric. Your budget allocation and bidding choices will be approved/rejected depending on if it will increase/decrease your total profit.
Specific scenarios when profit maximization makes sense are when:
- A product has held a stable organic rank.
- Stock levels are limited.
- It’s a highly profitable product.
Market share capture — when you’re acquiring customers at scale
In this case, you’re not optimizing for margin per unit like with profit maximization, but making changes that will grow your share of voice and rank dominance. It’s an aggressive investment phase that will hopefully help you to own the top three positions and capture a disproportionate share of clicks and conversions. A better organic rank position offers long-term value as you’ll become less reliant on paid traffic which will ultimately exceed the short-term cost involved.
That said, only certain scenarios can justify the capital burn it will require to win bids. These include when you’re:
- Launching a new product in a category with demonstrated demand
- Entering with a superior product
Stock clearance — when inventory costs outweigh margin
When stock clearance is the goal, you’re forgetting about optimizing for profitability, rank, or long-term positioning. Instead, you want to improve the rate of units sold of a specific ASIN within a defined period, even if it means losses. If you recover as much of the original inventory investment, the campaign is a success.
Stock clearance becomes the goal when the cost of holding will be more than the cost of selling. For example, it could be that:
- You’re expecting a new purchase order which means you’ll exceed your storage capacity.
- A product is getting updated (e.g., a new formula or packaging).
- You’ve decided to exit a specific category.
- You overestimated demand.
- It’s a perishable or very seasonal product.
Case study: How Bullstrap used launch velocity to generate a 85% revenue increase
The Bullstrap case study shows how launch velocity can effectively be applied to a competitive category. In this case, the premium lifestyle brand wanted to stand out in the luxury tech accessory market
The strategy involved segmenting campaigns by ASIN, optimizing it for TACoS, and using a combination of branded, non-branded, and competitor terms. This coordinated PPC strategy, along with optimized listings and keyword planning, backed each new product Bullstrap launched.
The Five Amazon Ad Types You Need to Understand
Sponsored Products
Sponsored Products offers great flexibility as you can choose which products you want to advertise, the audience you want to target, and the duration and budget for the campaign. When a user clicks on your ad, they’ll get redirected to the specific product’s detail page and you’ll be charged according to the amount you set for each click.
With Sponsored Products, your ads will appear in very visible locations on Amazon, like its search results and product detail pages. It can also include off-Amazon placement on publisher sites like Pinterest, BuzzFeed, and other highly regarded US publishers, but these are a secondary, automatic extension. That said, it’s important for Amazon publishers to turn off these additional placements so that they can maximize their budget on Amazon which has the highest conversion rate and ROI.
Beyond keyword targeting, Sponsored Products also supports two ASIN-level targeting methods worth building into your campaign architecture. These are:
- Product Attribute Targeting (PAT): Lets you target specific competitor or complementary ASINs directly — your ad appears on their product detail page.
- Category targeting: Allows you to target an entire product category rather than individual keywords or ASINs.
Both are separate campaign types from keyword campaigns and should be structured as their own campaigns in a properly built account, never mixed with keyword campaigns in the same ad group.
Recently, Amazon also introduced a new ad format allowing brands to use interactive videos. You can upload as many as five product feature videos with a descriptive text for each feature. Using shoppers’ browsing history and search query, Amazon will determine which three video thumbnails to display.
The early data is meaningful: Amazon's internal testing showed a 9% click-through rate (CTR) lift on Sponsored Products campaigns with video versus without, and an 8x CTR lift for the 20% of shoppers who watched the video for more than 5 seconds.
Our take is that this format is closer to a listing optimization lever than a traditional video ad. Unlike Sponsored Brands Video, which sells the brand, Sponsored Products Video sells a specific ASIN with native-feel creative — no burnt-in text, logo overlays, or slideshow motion (Amazon rejects all three). For high-margin ASINs with multiple demonstrable features, it's one of the highest-leverage creative tests available in 2026.
Sponsored Brands
Sponsored Brands runs in two distinct creative formats.
The standard format displays a headline, brand logo, and a set of products at the top of the search results, linking to your store or a custom landing page.
The video format adds a video to that unit — it still carries your headline and logo, making it a full branded creative experience. This is distinct from Sponsored Brands Video (SBV), which runs video only with no surrounding brand frame. The SB Video format is higher-funnel and brand-building; SBV is the primary new-to-brand acquisition vehicle covered in detail in the next section.
You can select the following:
- Campaign duration
- Budget and bid amount
- Cost per click, cost per 1,000 impressions, or a fixed, upfront payment
- Campaign goal (e.g., page visits)
- What shoppers will see (e.g., a set of products relevant to their interests, a store spotlight, or brand video)
Alternatively, you can let Amazon’s AI select the most relevant products. This feature which was introduced in 2026 uses campaign targets and shopper signals such as search intent and browsing behavior, improving discoverability and engagement.
For Cactus Scratcher, one of our clients, this placement generated 80% of its profitable PPC sales.
Sponsored Display
Display campaigns use shopping, browsing, and streaming insights from Amazon to display your video or image ads to relevant audiences on Amazon as well as partner networks like Twitch. This placement works really well for remarketing campaigns as well.
Sponsored Display uses two billing models depending on your goal:
- Cost-per-click (CPC) for campaigns optimized toward direct conversions
- Viewable cost-per-thousand impressions (vCPM) when the goal is reach and retargeting at scale
For most Seller Central brands running SD for the first time, CPC is the safer starting point. Once you have audience data to target efficiently, vCPM makes more sense.
Streaming TV (Formerly Sponsored TV)
Streaming TV ads are full-screen, nonskippable video ads that can appear before, during, or after content streamed on Prime Video, Twitch, and other popular TV broadcasters. It also allows you to add QR codes that will redirect them to your store or specific product detail page, further increasing the interactive nature of these types of ads.
Amazon DSP
Amazon DSP allows you to reach your shoppers using various ad formats. The marketplace also recently updated its AI-powered Campaign Manager so that it now serves as a unified hub that simplifies setup, management, and optimization. It includes features like:
- Guidance cards
- Multi-account management
- Standardized reporting
- Consolidated KPI bar
The Sponsored Brands Video Opportunity: How Olifant Digital Acquires New-to-Brand Customers
Sponsored Brands Video (SBV) is the most underused high-leverage format in Amazon's ad ecosystem. It refers specifically to the video-only format (no headline or logo frame) that runs inline within search results. This is distinct from the SB Video format, which wraps a video inside a full Sponsored Brands unit with headline and logo.
While most brands and agencies treat it as an experimental add-on, Olifant Digital deploys it as a primary new-to-brand (NTB) acquisition vehicle. SBV's stripped-back format is what drives its outsized NTB performance. The video occupies the full creative space and competes directly for shopper attention in the search feed.
Why most agencies underuse this format
When new clients come to Olifant Digital without Sponsored Brands Video running, the reason is almost always one of the following three things:
- Brand Registry requirement
- Creative production friction
- Tool-led optimization blind spot
Sponsored Brand is only available to vendors and sellers that’ve joined the Amazon Brand Registry. Many agencies don’t prioritize getting their clients registered, which immediately eliminates them from leveraging SBV.
Then, if the agency lacks in-house video capability, image-only formats often become the default option. Video demands scriptwriting, filming or animation, music licensing or voiceover, and editing. This requires investment in talent, software, and time that many mid-sized agencies simply don’t have or can’t afford.
At Olifant Digital, SBV creative production isn’t an afterthought. It is an integrated capability for us, not a service we need to outsource. This immediately eliminates creative production friction.
Not only are videos more expensive, but for most PPC tools that optimize against ACoS, SBV looks expensive. However, these tools often ignore the NTB order rate. Because SBV is such a visual, engaging format, it can be very effective at introducing a brand to new shoppers.
How SBV drives NTB acquisition (and why that metric matters)
NTB orders refer to customers who have not purchased the brand on Amazon in the prior 365 days. NTB order rate measures the percentage of total orders from a format (like SBV) that are NTB.
SBV's NTB order rate typically outperforms Sponsored Products on branded terms because of the format's visual impact on shoppers who haven't previously encountered the brand. It often looks expensive on ACoS but produces customers worth 2–4× more lifetime value (LTV) than repeat customers acquired through Sponsored Products on branded terms. The right metric for SBV is not standalone ACoS — it's a blended NTB-weighted ROAS, which Olifant uses as the primary SBV efficiency metric.
On accounts with established Sponsored Products performance and Brand Registry, Olifant Digital typically allocates 8–15% of the total Amazon ad budget to SBV with NTB order rate as the primary efficiency metric, not standalone ACoS.
⭐ Image 9: NTB Order Rate chart (SBV vs Sponsored Products)
When to deploy SBV (and when not to)
If you’ve enrolled for Brand Registry, SBV is the right format when:
- Sponsored Products campaigns are stable and profitable.
- Your brand has enough features and USPs that will benefit from demonstration.
- Building category awareness is your goal.
While we believe that SBV should be used more, it’s not always the best format. We won’t implement or recommend SBV when:
- Sponsored Products are still losing money.
- Listing conversion rate falls below the category median.
- It’s for an undifferentiated commodity product.
When the product is self-explanatory, and price and reviews are enough to sell the product, SBV is the wrong format. To use video effectively, your product needs features that you can demonstrate or use to connect with shoppers emotionally.
Take basic office supplies like glue, for example. There’s nothing spectacular about it that’s going to keep consumers glued to their screen.
Creative requirements that actually work in 2026
🎨 Image 8: SBV creative best practices infographic
If your brand and product meet the previous criteria, here’s how we’d recommend you structure your videos:
In the first two seconds, ensure that your product is visible. As 15 seconds is the sweet spot for the total duration, you don’t have a lot of time. So, skip creating an atmosphere or introducing your brand logo first.
Your brand mark is best kept for the final frame. The last 1.5 seconds of your video should be reserved for your product and brand mark. While some agencies will argue it’s better to let it fade out, we believe the opposite approach works better. A static hold communicates authority and it increases dwell time on your logo.
After all, you’re not creating for the TV where fading out can be read as a cinematic effect. On Amazon, ads that feel like repurposed TV-style ads of lifestyle-only videos with no product hero don’t work.
Which brings up the last crucial creative requirement — mobile optimization. The majority of Amazon traffic is generated via mobile devices. As such, your aspect should be vertical-first and captions should be always on to accommodate shoppers on the go.
The Biggest Platform Changes of 2026 (And What Olifant Digital Recommends)
With AI now reshaping how customers discover, compare, and buy, platform changes have been introduced faster. Here are the main changes that senior managers running $50,000+ in monthly ad spending will need to consider to ensure their PPC strategy stays ahead of the curve and remains effective.
🎨 Image 10: 2026 platform changes timeline
AI-powered prompts are now billable (March 25, 2026)
Introduced in November 2025 in open beta, Amazon’s AI-powered shopping prompts have now been switched to general availability in the US. As with most changes, there’s a cost involved and Amazon started charging for these ads as part of your cost per click (CPC) bidding.
While you’ll no longer have free access to it, our recommendation is to keep it enabled. Just make sure that you audit your daily spend weekly for the first 60 days.
According to our data, you can expect anything from 4% to 17% incremental spend across managed accounts. Your listing content quality will be the strongest profitability predictor.
Unified Campaign Manager (live since November 2025)
As briefly mentioned early, Amazon updated its Unified Campaign Manager to create a central hub for sponsored ads and multimedia solutions with Amazon DSP. This means that you can plan, activate, and measure all your ad campaigns via a single platform.
It’s a major operational improvement. According to its data shared on its website, the smart search feature, for example, can reduce bid optimization workflow by 26%. Our experience has revealed that the new changes can save cross-channel brands three hours per week that they would’ve spent on reconciliation per account.
Conversion path reporting
At the end of 2025, Amazon expanded conversion path reporting across the globe. In short, it lets you see all the ad touchpoints a customer had during the 30 days leading up to conversion. This way, you get a sense of your media mix’s real impact (e.g., which ad formats move customers down the funnel), helping you uncover optimization areas.
Our recommendation is to use it for budget allocation, instead of last-click optimization. The benefit of conversion path reporting is that you can see which ad format combinations work, not just the final ad a shopper clicked before purchasing.
Vendor Central vs Seller Central: How PPC Strategy Diverges
⭐ Image 11: Vendor vs Seller Central comparison
Most Amazon PPC strategies are built for Seller Central, with roughly 30% of the brands Olifant Digital manages running Vendor Central. Vendor PPC strategy diverges from Seller Central in three specific ways most agencies underestimate.
The three differences that matter most
The following are the main differences to plan around:
Retail price control: In Seller Central, there’s a direct link between your profitability and ad spend as you set the retail price. However, in Vendor Central, Amazon’s algorithm, and not the vendors, set the retail price. This means that your ACoS can increase without any bid changes.
CoOp funding: Vendor PPC is often funded via CoOp/market development funds (MDF). If PPC campaigns run hot early in the quarter, the same pool that was meant to fund a Prime Day Lightning Deal fee can already be drained. When this happens, you’ll have to pay the promotional event out of pocket or skip it.
Chargebacks: Chargebacks and operational penalties are billed against your account automatically. PPC-driven demand spikes can trigger shortage chargebacks, if supply chain doesn’t match.
How to structure PPC when Amazon sets retail price
Our key recommendation is to model ACoS targets against net wholesale margin after trade terms, not list price. The list price is not your revenue, it’s Amazon’s. When you model ACoS against retail price, you’re calculating your ad efficiency as a percentage of the money you’ll never see. This creates a target that’s only achievable on paper.
Even using your wholesale margin before deducting costs stipulated in trade terms can create a significant gap. There are shortage terms, freight allowances, etc. to consider which, added up, can make a meaningful difference.
Hidden costs vendors should model before scaling spend
Before you can approve any ad budget increase, you should first estimate the following four cost categories:
CoOp/trade terms erosion: The goal is to convert your gross invoice price into a net realized revenue per unit. Put simply, you want to work out how much you’ll actually earn after Amazon has received all the contractual and operational deductions.
Retail price compression: This often creates downstream secondary costs that vendors underestimate. For example, it can lead to weakened brand positioning, conflict with other retailers carrying your product, and gross margins to deteriorate.
Demand spike chargebacks: These refer to penalties that you can incur when a sudden surge in demand is more than what you forecasted and your inventory can fulfill. It’s considered a hidden cost because they show up only after periods of rapid growth.
MDF reallocation friction: This happens when operational and financial inefficiencies make it difficult to redirect or recover advertising budgets inside Amazon’s vendor ecosystem. The hidden cost shows up in the wasted marketing efficiency. While funds are tied up, you might miss influencer campaigns or better-performing ad channels, for example.
Olifant's approach to Vendor Accounts
When working with Vendor Accounts, Olifant measures TACoS against net wholesale revenue after trade terms (the only honest denominator) and ties chargeback monitoring to PPC velocity. PPC-driven demand spikes can outpace supply chains, triggering shortage chargebacks. By monitoring chargebacks alongside ad velocity, Olifant catches these before they hit the profit and loss statement.
We also align weekly with an Amazon Vendor Success (AVS) manager. These regular syncs focus on promotional calendars, forecasting, and PPC velocity so CoOp funds don't get drained before key events like Prime Day.
The Math Behind Every PPC Decision
Break-Even ACoS: The Worked Example
Your break-even ACoS is the percentage of ad-attributed revenue you can spend on ads before the ad cost fully consumes your contribution margin. At break-even, every ad-attributed sale generates zero profit. This means you're not losing money on the sale, but you're not making any either.
Let's work through a typical mid-tier ASIN — a supplement brand selling a protein powder at a retail price (P) of $40.
First, work out the total per-unit cost:
- Cost of goods sold (COGS) = $10.50
- FBA fees (F) = $6.40
- Referral fees (R) = $6.00 (15% × $40)
- Inbound shipping (S) = $0.50
- Returns reserve (T) = $0.80 (2% × $40)
- Other per-unit (O) = $0.30
Total per-unit cost = $24.50
Next, calculate contribution margin per unit:
Contribution margin = Retail price − Total per-unit cost
In this case, it’s $40.00 − $24.50 = $15.50
Then, divide contribution margin by retail price to get your break-even ACoS:
Break-even ACoS = Contribution margin per unit ÷ Retail price
$15.50 ÷ $40.00 = 38.75%
This is the point where every dollar of ad-attributed revenue is fully consumed by ad spend plus product costs. Anything below 38.75% generates a positive contribution on ad-attributed sales. Anything above is losing money on ads at the unit level. To hit a target net margin (not just break-even), you'll need to come in meaningfully below this number — which is what we'll calculate with target ACoS next.
Want to run this calculation on your own ASINs? Get the Margin Calculator (Excel + Sheets). It’s a pre-built spreadsheet where you can add your own retail price, COGS, FBA fees, and other numbers to determine your break-even ACoS.
You can also use our free ACoS calculator.
⭐ Image 12: Break-even ACoS worked example callout
Target ACoS: How to set it from unit economics
Let’s say this same supplement brand wants a 10% net margin after ad spend, here’s how to work out the target ACoS it will need to chase:
Target ACoS = Contribution Margin Per Unit - (Desired Margin x Retail Price) ÷ Retail Price
= ($15.50 − $4.00) ÷ $40.00
= 28.75%
💡 Pro Tip: TACoS is the single most important profitability metric in a mature Amazon account. At $50,000+ monthly spend, if you’re not tracking TACoS weekly, you’re managing the wrong number.
You can also use our TACoS calculator to automate the calculations.
The Bid Formula: AOV × CVR × Target ACoS
Using the bid formula, you’ll determine the maximum cost per click you can afford to spend.
Here’s its formula:
Maximum Cost Per Click = AOV × CVR × Target ACoS
Let’s say your average order value (AOV) is $40, CVR is 12% and Target ACoS is 28.75%.
$40 × 12% × 28.75% = $1.38
This means that your maximum CPC will be $1.38.
If your current bid on a keyword is $1.80 and your conversion rate is 12%, you're bidding above break-even. Either reduce the bid to $1.38 or improve your conversion rate to support the higher bid.
Here's the Bid Calculator — no email needed. Plug in your AOV, conversion rate, and target ACoS to get your max CPC instantly.
⭐ Image 13: Bid formula + Profit Per Click callout
Profit Per Click: The Metric That Matters More Than ACoS
Profit Per Click = (Product Profit × CVR) − CPC
Using the same numbers above, this means that this supplement brand generates $0.48 profit for every click.
($15.50 × 12%) - $1.38 = $0.48
At 12% CVR and $1.38 CPC on this ASIN, every click generates $0.48 in profit. If CVR drops to 9%, profit per click drops to $0.02 — barely break-even.
This is why listing optimization is part of PPC management, not separate from it.
💡 Pro Tip: Profit per click is a more actionable signal for when to optimize than ACoS alone. Remember to track it by placement too as one keyword can be more profitable at top of the search than in product page placement.
The Kill Threshold Rule: When to pause or significantly lower a bid
Olifant Digital’s rule is that if a keyword or ASIN target runs at 2× your break-even ACoS for 14 or more days, despite bid adjustments and negative keyword cleanup, it's a budget drain. Either pause it or reduce the bid to the floor and re-test. In competitive niches, shorten the window to 7 days.
Keyword Strategy: The Foundation of Every Profitable Account
Match type architecture
Match type architecture is when you deliberately structure your campaigns around Amazon’s three key match types, namely broad match, phrase match, and exact match. Each match type has a specific role to play in a structured account.
With broad match types, your ad is displayed when a search query has your keyword terms regardless of the order. The search query can also have related terms, synonyms, and loose variations. It should only be used in early discovery campaigns and in its own campaign (never mixed with exact match types in the same ad group). In fact, mixing any match types in a single ad group is an architectural mistake as it destroys attribution. Instead, each match type should have its own campaign (like we do in our 1-1-1-1 Method).
You can also use phrase match types in discovery. In this case, your ad is shown when the search query contains your keyword as a continuous sequence. That said, as additional words may appear before or after your keyword, it helps you capture intent variants, making it very suitable for the middle layer.
Exact match captures the highest intent and needs the tightest bid control. In this case, your ad is only shown when search queries match your keyword very closely with only minor variations like plurals accepted. Once a keyword has delivered results, Olifant Digital will use exact match types as the main scaling strategy in our 1-1-1-1 structure.
💡 Pro Tip: Segment your keyword portfolio by match type across separate campaigns rather than using broad, phrase, and exact in the same ad group. This gives you clean search term data per match type and lets you bid independently at each funnel stage.
The Keyword Harvest Loop
The Keyword Harvest Loop is a continuous operational cycle used to convert discovery spend into scalable, controlled exact match campaigns over time. It’s essentially about turning raw data into more refined keyword structures.
Here’s how:
- Launch auto or broad campaigns to collect search term data
- After 7 to 14 days, pull the search term report
- Study the search term report to identify converting search terms (consider CTR, ACoS, and search volume)
- Promote these keywords to exact match in their own 1-1-1-1 campaign
- Add the original broad/auto search term as a negative in the discovery campaign to prevent cannibalization
- Repeat this process weekly
💡 Pro Tip: The Keyword Harvest Loop is only as good as the cadence behind it. Once you reach $10,000 in monthly spend, a weekly cadence is recommended.
Negative keywords: The profit lever most sellers underuse
Negative keywords are terms you want Amazon explicitly not to match your ads against. In other words, search queries from which you want your ad to be excluded. These can be irrelevant search terms that waste your budget or converting terms that you’ve identified before or during the Keyword Harvest Loop and want to exclude from discovery campaigns to avoid cannibalization.
A common mistake brands make is managing negative keywords only at campaign level. However, it should be managed at ad group level.
Also, it's best to review negative keywords every two weeks, instead of monthly.
💡 Pro Tip: Olifant's analysis of 50+ managed accounts found that accounts in their second year of optimization average 4.3× more active negatives per ASIN than first-year accounts and 18% lower ACoS as a result. To achieve this growth, add negatives every 7 to 14 days, not monthly.
Search query performance: The diagnostic most sellers skip
Most sellers use only the search term report inside the Campaign Manager. However, the search query performance report (SQP) in Brand Analytics is a layer above and provides brand-level intelligence instead of just campaign-level data.
Here you’ll find:
- Impression share
- Click share
- Purchase share
What makes this data especially useful is that it’s by keyword. Also, it doesn’t just reflect your own performance but the full category’s performance too.
Alongside the search term report, it becomes a powerful keyword research tool. You can use it to identify keywords where you have a strong click share, but low purchase share (this could indicate a listing CVR problem), and keywords where you have low impression share (a sign of a bid or relevance problem).
💡 Pro Tip: If a search term converts with minimal impressions it’s usually a signal of untapped potential. Prioritize those terms before competitors notice them.
The common keyword mistake (and how Olifant Digital catches it in audits)
The most common error we see in audits is broad match keywords inheriting traffic from suspended exact match campaigns. This happens when negatives are managed at campaign-level only.
To avoid this, we use ad-group-level negative management. Then, we ensure that there’s a 14-day rolling search term review cadence.
Bid Optimization: Setting Bids That Protect Profitability
Margin tiering: High/Medium/Low ASIN bid tolerance
Not all ASINs in an account should be held to the same ACoS target. For example, a product with 60% margin can still be profitable even though you apply an aggressive bid strategy, while a product with only a 30% margin will struggle at the same bid.
With the help of margin tiering, you can set differentiated targets per ASIN before you look at bids. To do this, organize ASINs into the following three tiers based on contribution margin:
- High margin (e.g. >40% contribution margin): This group has a higher ACoS tolerance which means that you can bid more aggressively and sustain higher CPC without going below break-even.
- Medium margin (e.g. 20–40%): For this group, use standard bid levels and optimize to target ACoS.
- Low margin (e.g. <20%): Here, you’ll need to apply tight bid control. Even small CPC increases can result in a loss. These ASINs are often better served with exact match only and minimal discovery spend.
💡 Pro Tip: Bid strategy should always be anchored to contribution margin. Segment bids using product margin tiers. For example, SKUs with the highest margins should run in separate campaigns with distinct bid ceilings.
Across Olifant's managed accounts, ASINs tend to cluster heavily in the medium margin (20–40% contribution margin). High-margin ASINs - typically hero SKUs and bundles - are the ones that unlock aggressive scaling. Low-margin ASINs are managed defensively with exact match only.
Dynamic vs. fixed bidding strategies — and when each wins
With a dynamic bids - up and down strategy, bids are adjusted in real time based on conversion likelihood. Amazon recommends using this strategy for mature campaigns.
However, Olifant Digital uses fixed bids where you have full manual control on brand defense. We do this specifically because dynamic bids - up and down overbids on top-of-search placements that already convert at 35%. Fixed bids are also better for high-margin exact match campaigns where you’ve already established the right bid through data.
In addition to these two bidding strategies, you can also explore dynamic bids - down only. With this strategy, bids are reduced when Amazon predicts low conversion likelihood. It’s safer than dynamic bids - up and down for accounts where overbidding is the bigger risk.
💡 Pro Tip: Use fixed bids on exact match campaigns where you’ve already done the work to set a defensible bid. If overbidding is a risk, use dynamic bids - down only.
Placement bid multipliers
Placement bid multipliers refer to percentage adjustments you apply on top of your base keywords bids. These are used to increase how aggressively you’re willing to compete for specific positions (aka placement types).
The three placement types, each with its own conversion profile, to which you can apply these percentages are:
- Top of search: It’s best to use these multipliers conservatively as it costs more per click and converts at a higher rate.
- Product page placements: Here, you’ll appear on competitor and complementary ASINs. These placements often have a lower conversion rate, but it can be profitable if your goal is to capture market share.
- Rest of search: The rest of search has no multiplier and serves as the baseline.
💡 Pro Tip: Before setting any multipliers, it’s best to pull placement data to see the actual ACoS. You can find this data via the Campaign Manager > Placements tab.
Case study: How daily bid optimization cut Beauty by Earth's ACoS in 60 Days
The work we completed for Beauty by Earth, an 8-figure beauty brand that sells natural skincare products, shows why it’s key that you approach Amazon PPC management with a clear, structured bidding strategy and daily bid optimization. Olifant audited and restructured the ad account using the 1-1-1-1 Method. We segmented and organized campaigns by ASIN, match type, and targeting strategy.
We also delivered weekly TACoS reports across all 100+ ASINs. This helped the brand to make data-driven budget decisions and within 60 days, the restructured account had reduced wasted spend. On top of that, it improved TACoS across all 100+ ASINs (with a 27% revenue increase confirmed in the first 30 days alone).
💡 Pro Tip: Before adjusting any bid, check your inventory status. Continuing to advertise out-of-stock ASINs costs more than wasted clicks. It suppresses organic ranking momentum that takes weeks to rebuild.
The Metrics That Actually Matter
ACoS — and why it's not enough on its own
To work out ACoS, you divide your ad spend by your ad-attributed revenue only. This means that it measures the efficiency of only your paid clicks.
The issue with this approach is that an account can still have a healthy ACoS even though its organic revenue is declining. In other words, your ads are doing more work and your account is becoming more ad-dependent and not more profitable.
TACoS: The metric that reflects true account health
To work out your TACoS, you divide your ad spend by all the revenue you generated via paid and organic. If your TACoS is declining over 60 to 90 days while your revenue grows, it’s a clear indicator that PPC ads are improving organic rankings and the Amazon flywheel is in action (refer to the section PPC and Organic Ranking: How They Compound The Amazon Flywheel for a detailed explanation).
ROAS, CTR, CVR, NTB, and impression share — what each diagnoses
While ACoS and TACoS are the main metrics, you should also track:
- ROAS (return on ad spend): It’s the inverse of ACoS as it measures how much return your ad spend generated instead of the cost involved. While it’s useful for stakeholder reporting, it has the same limitation of measuring only ad-attributed revenue.
- CTR (click-through rate): It can diagnose your listing’s appeal at the search results level. If it’s low it could indicate issues with your main images or title and not your bid strategy.
- CVR: Similarly to CTR, CVR indicates your listing quality. If your CVR drops, fix the listing before adjusting bids because sending more traffic to a weak listing will just increase the cost.
- NTB order rate: It’s the percentage of orders from customers new to the brand in the past 365 days. As discussed earlier in the section The Sponsored Brands Video Opportunity, it’s often used to track the efficiency of SBV campaigns.
- Impression share: It refers to your share of total impressions for a keyword. If you have a low impression share and a healthy ACoS, it could indicate a budget constraint or bid floor issue. In this case, there's room to scale.
Case study: How TACoS-first reporting transformed Onsen Secret's account
The Onsen Secret case study serves as a great example of why you need to track various key metrics and know what each one can diagnose. The premium skincare brand had a strong CVR, but growth had stalled while ACoS was rising. To reveal where the inefficiencies were actually hiding, Olifant shifted reporting from ACoS to TACoS.
This allowed us to create a smarter spend strategy where we focused on proven, high-converting ASINs. While its CVR was strong, we still optimized its listings first before scaling ads.
The result was an extra $95,934 in monthly revenue and triple the profits.
Both the following tables should be interpreted as diagnostic benchmarks, not targets. For example, a CPC above your category's high-end range is a structural signal (wrong keywords, wrong match types), not just a market condition (this ties directly back to the 1-1-1-1 method and long-tail keyword strategy already covered in the guide).
Olifant's ACoS tolerance ranges by goal
Objective
ACoS Tolerance
TACoS Target
Bid Strategy
Typical Duration
Launch Velocity
Up to 2× break-even ACoS (e.g. 60–80%)
Not primary metric yet — watch trend
Dynamic bids — up and down
Weeks 1–8
Ranking Defence
10–20% above break-even ACoS
Declining trend required
Dynamic bids — up and down
Ongoing, competitive phase
Profit Maximization
At or just above break-even ACoS
Flat to slightly declining
Fixed bids on top exact match terms
Peak seasons, Prime Day windows
Market Share Capture
10–15% below break-even ACoS
Actively declining
Fixed bids; exact match only
Stable, mature ASINs
Stock Clearance
At or above break-even (losses acceptable)
Not tracked
Dynamic bids — up and down; aggressive
2–6 weeks until clearance
CPC by category: Industry benchmarks for 2026
The table below, sourced from publicly available 2026 data, reflects industry benchmarks across major Amazon categories. Use these as a diagnostic reference. If your CPC is consistently above the high end of your category range, the issue is usually keyword selection (too many head terms) or bid architecture, not the category itself.
Category
SP CPC Range
SB CPC Range
Competition Level
Notes for Olifant clients
Beauty & Skincare
$1.50–$2.20
$2.00–$3.50
High
Highest CPC category; SBV is especially valuable here for NTB acquisition
Health & Personal Care
$1.10–$1.70
$1.60–$3.00
High
Supplements sub-category can exceed $2.10 SP; long-tail targeting critical
Supplements
$1.40–$2.10
$1.80–$3.20
High
Wide CVR variance by sub-niche; break-even ACoS modelling essential before scaling
Electronics
$1.00–$1.40
$1.50–$2.80
High
High ASP helps absorb CPC; review velocity matters more than in lower-ASP categories
Pet Supplies
$0.90–$1.40
$1.30–$2.40
Medium–High
Growing advertiser density; long-tail exact match increasingly important
Baby
$0.85–$1.30
$1.20–$2.30
Medium
Safety claims and trust signals significantly affect CVR in this category
Home & Kitchen
$0.80–$1.20
$1.20–$2.20
Medium
Broad category with wide CPC variance by sub-niche; segment campaigns tightly
Sports & Outdoors
$0.75–$1.15
$1.10–$2.10
Medium
Seasonal peaks in Q1 and Q4 drive temporary CPC spikes of 10–30%
Tools & Home Improvement
$0.80–$1.25
$1.10–$2.20
Medium
Considered purchase; strong A+ content and listing quality drives CVR
Clothing & Accessories
$0.70–$1.10
$1.00–$2.00
Medium
High return rates compress contribution margin; model break-even ACoS carefully
Automotive
$0.70–$1.10
$1.00–$2.00
Medium
Compatibility data in listings directly affects CTR and CVR
Toys & Games
$0.60–$1.00
$0.90–$1.80
Medium
Extreme Q4 seasonality; budget pacing critical Oct–Dec
Grocery & Gourmet
$0.50–$0.90
$0.80–$1.60
Medium
Subscribe & Save eligibility significantly improves LTV and NTB economics
Office Products
$0.55–$0.85
$0.80–$1.50
Low–Medium
Low CPC but also low AOV; break-even ACoS modelling especially important
Books
$0.35–$0.55
$0.50–$1.00
Low
Lowest CPCs on platform; organic ranking carries more weight than paid
Sources: Keywords.am 2026 benchmark data across 15 categories; Sequence Commerce 2026 Amazon advertising statistics; Ad Badger 2026 CPC tracking data
What’s interesting to note is that the average Amazon CPCs increased 35% between 2023 and early 2026, rising from $0.89 to $1.21 across all ad types. This sharp increase is driven by increasing advertiser competition and Amazon's expanding ad inventory.
Here’s how the CPCs per ad type average so far in 2026:
- Sponsored Products $0.75–$1.50 per click
- Sponsored Brands $1.00–$2.50 per click
- Sponsored Display $1.50–$3.00+ per click
What’s more, in Q4 2026 peak CPCs are expected to hit $1.35–$1.45 during the holiday season, with Prime Day driving seasonal spikes of 10–30%, especially in Toys and Electronics.
How Olifant Digital Manages Amazon PPC
If you're managing Amazon PPC in-house or with an agency that optimizes weekly and doesn't track TACoS, book a free audit with Olifant Digital. We'll review your account structure, identify where ad spend is leaking, and show you exactly what senior-led daily optimization looks like and what to do next — no obligation.
Get Your Free Amazon Marketing Plan
Daily optimization
Daily optimization, as opposed to weekly, means faster response to performance signals, resulting in tighter budget control. Amazon is dynamic with competitor bids and shopper behavior changing continuously. A keyword that’s draining your ad budget should be adjusted within a matter of a few days, not closer to a week.
TACoS-first reporting, per ASIN, every week
TACoS paints a more truthful picture about your ad campaigns’ performance. Even when ranking defence or market share isn’t the primary goal, it’s key to grow your organic presence to avoid costly ad-dependency. TACoS-first reporting flags those structural problems that can create over-reliance on paid traffic early.
Listing optimization as a PPC prerequisite (with diagnostic checklist)
Sending paid traffic to a weak listing is like trying to fill a punctured tire or leaky bucket. You first need to fix the underlying issue, otherwise you’re just going to be wasting money.
Paid ads will highlight what’s there and if they point to a confusing title, low-quality images, or thin bullet points, the CVR will remain low. To prevent you from paying for clicks unlikely to convert, listings first get optimized systematically.
Case study: How listing optimization drove Elite Jumps' 51% CVR lift
The Elite Jumps case study shows the impact that rebuilding your product listings can have on your conversion rate, and ultimately ACoS. The performance-driven fitness brand’s hero images, product titles, bullet points, and A+ content were A/B tested and improved to remove friction from the path to purchase.
Listing optimization was combined with precision targeting of low-competition, high-intent search terms and PPC. This three-phase strategy meant that not only was the conversion rate increased by 51%, but ACoS was also reduced and organic rankings boosted. As Jordan Lindstrom, CEO at Elite Jumps, puts it, "After trying dozens of different agencies… nothing clicked until we partnered with Olifant Digital."
Operator credibility: We run our own 7-figure Amazon brand
Because Olifant Digital runs its own 7-figure Amazon brand, the team has a different set of expertise to offer. We had the opportunity to sharpen our judgement and validate what works on our own product lines before recommending these strategies to clients.
Senior-only team: 7 years' minimum experience, US + UK + EU coverage
All the team members assigned to your account have already completed the learning curve. We’ve also been long enough involved in Amazon marketing to see how the algorithm and platform have changed, allowing us to adapt quickly to new changes like the Unified Campaign Manager introduced in 2026.
The Optimization Cadence: Daily, Weekly, Monthly, Quarterly
⭐ Image 16: Optimization cadence timeline
Here’s what the Olifant team covers at the following specific intervals:
Daily: Each day we adjust bids, review the performance of keywords, pace budgets, and flag any ASIN running above break-even ACoS. While these actions are carried out daily, we wait 48 hours before reducing any bids to ensure we react to a definite signal, not just noise.
💡 Pro Tip: Avoid that premature optimization destroys your account by not reacting to single-day CPC spikes. Amazon's 48-hour attribution lag means yesterday's data is incomplete. Wait 48 hours before any bid reduction, and use 7-day rolling data for all optimization decisions.
Weekly: Each week we complete the Keyword Harvest Loop. We pull the search term report, promote converting terms to exact match, add negatives, report TACoS per ASIN, and review placement performance data.
Monthly: Once a month, we review the campaign architecture review to identify any structural issues. We also run match type audits and use 30-day performance data to reallocate budgets across campaigns. If a listing’s CVR has dropped, we pause bid scaling and fix the listing first.
Quarterly: Each quarter, we review business goals with the client. We check if the 90-day goal has been hit and if the goal should shift (e.g., from launch velocity to profit maximization). Then, we also adjust ACoS tolerance bands accordingly.
💡 Pro Tip: Treat each cadence level as a different decision layer. Daily is reactive (e.g., adjust bids, catch waste). Weekly is diagnostic (e.g., harvest keywords, review TACoS). Monthly is structural (rebuild campaigns, if needed). Quarterly is strategic (reset objectives). Making structural decisions daily or strategic decisions monthly is how accounts lose discipline.
Campaign Launch Strategy: Getting New Products to Profitability
⭐ Image 17: Campaign launch phase timeline
If you're managing Amazon PPC in-house or with an agency that optimizes weekly and doesn't track TACoS, book a free audit with Olifant Digital. We'll review your account structure, identify where ad spend is leaking, and show you exactly what senior-led daily optimization looks like — no obligation.
Get Your Free Amazon PPC Audit
Phase 1: Discovery and data collection (weeks 1–4)
Launch auto and broad match campaigns to collect search term data. Bids are intentionally set slightly above break-even ACoS because you're buying sales velocity to seed organic ranking, not optimize for profit yet.
Only after the first week will you introduce negative keywords (you first need the data). Then, between day 7 and day 10, the first search term report will also get pulled.
Phase 2: Optimization (weeks 4–8)
Now is the time to apply the Keyword Harvest Loop. Promote converting search terms to exact match in 1-1-1-1 campaigns. Add negatives to discovery campaigns to prevent cannibalization and begin tightening bids based on actual CVR data. If listing diagnostics reveal that CVR is below category median, listings should first get fixed before scaling spend.
Phase 3: Scaling (weeks 8+)
Exact match campaigns with proven keywords are now the primary scaling vehicle. Use margin tiering to set differentiated ACoS targets. Begin TACoS-first reporting and watch out for a declining TACoS while revenue grows as a signal that the flywheel is spinning. If Brand Registry is active and Sponsored Products are profitable, now is also an optimal time to introduce Sponsored Brands Video.
Case study: How Ekster generated $688K per year profitability lift
The Ekster case study serves as a great example of the work that goes into getting ready for launch on Amazon. The smart wallet brand knew the stakes were high as its Amazon channel had to be as polished as its DTC business.
Every new product release used the proven formula: optimizing listings, running PPC ads, and gathering reviews early. With this diligent approach, its flagship wallets became category leaders.
PPC and Organic Ranking: How They Compound (The Amazon Flywheel)
Amazon’s A9/A10 algorithm treats sales velocity as a core organic ranking factor. This creates a compounding loop where paid and organic performance reinforce each other. For example, PPC drives sales, sales improve organic ranking, improved rank drives more organic sales which reduces ad dependency and your TACoS falls.
This flywheel (the compounding loop) is why launch-phase ACoS is deliberately above break-even. Early-stage spend isn’t buying revenue. Rather, you're buying sales velocity to seed organic ranking. The goal is to get this flywheel going.
An account that can tolerate a higher ACoS at launch and have TACoS reducing each month is executing PPC correctly. By contrast, if TACoS is flat or rising as your revenue grows, the account is dependent on ads. TACoS is the metric that reveals whether the flywheel is spinning.
The goal shouldn’t be to optimize ACoS to break even from day one, because you’ll never get this flywheel spinning.
Elite Jumps is proof. The Olifant Digital’s team ran PPC and SEO in tandem, improving organic ranking through coordinated optimization while the organic ranking improvement again boosted the paid performance. The result was a 124% revenue growth and 51% conversion rate lift in only three months and that in a highly competitive market.
The results Onsen Secret achieved reinforces the same point. Olifant first improved the listings, then scaled to more competitive keywords. Amazon's algorithm rewarded the stronger performance with higher organic rankings, multiplying both paid and organic visibility.
How to Evaluate an Amazon PPC Agency
Most Amazon sellers use pitch decks and claims to choose a PPC agency, when the selection process should be more of an interview. After all, a good PPC agency will become a long-term partner acting as an extension of your team.
Here are the seven questions you should ask:
Do they optimize daily or weekly?
This is the single most important differentiator and many agencies fail it immediately. Weekly optimization on accounts spending over $5K per month won’t maximize your revenue. Anything other than daily optimization gives enough time for bid inefficiencies and wasted spend to have a noticeable negative impact.
Do they track TACoS or just ACoS?
As mentioned earlier, TACoS is the metric that reveals if your paid and organic efforts are strengthening each other. Without knowing the TACoS for each ASIN weekly, the PPC specialists won’t be able to tell if your organic rank is solid too.
Is the team senior?
It’s not just a matter of how experienced the team is, but determining the seniority and background of the members assigned to the day-to-day management of your account. For Olifant Digital, the standard is set at seven years’ minimum experience per individual, not averaged across the team.
Do they treat listing optimization as part of PPC?
Sending paid traffic to a weak listing is one of the most common and costly mistakes. Olifant's diagnostic listing audit before any spend increase is the right model. The connection between listing strength and conversion is shown in the results Elite Jumps achieved. After having their listings reworked, conversion rate increased by 51% which, in return, unlocked the 124% revenue growth.
Can they show named case studies with specific numbers?
Named clients, verified numbers, and specific timelines — these are the trust signals you need.
Do they cover the US, UK, and EU?
Agencies without cross-market experience will give you a US-only playbook on a multi-geography account. This will become an issue because Amazon’s major marketplaces aren’t interchangeable. Aspects like search behavior, competitor landscape, keywords, and seasonal patterns differ significantly across the UK, EU, and US.
Do they have operator credibility?
There’s a noticeable difference between an agency that only manages client accounts and one that runs its own Amazon brand. The latter improves their decision-making because they’re used to working in scenarios where making the wrong call has direct consequences.
📷 Image 19: Alex Stoykov bio photo
Free Resource: The Olifant Amazon PPC Resource Library
Reading about PPC strategy is one thing. Having the right tools ready when you’re in the account is another. The library below collects the five resources we rely on across every campaign we run — yours to download, free.
Enter your email to get instant access.
📥 Get the Olifant Amazon PPC Resource Library — Free
Five operator-grade tools we use on every account we manage:
- The 1-1-1-1 Scaling Method Audit Checklist (28-question PDF)
- The Margin & Break-Even ACoS Calculator (Excel + Google Sheets)
- The Bid Calculator
- The Amazon PPC Glossary 2026
- The Campaign Naming Convention Template (Excel + Google Sheets)
Frequently Asked Questions
- What is a good ACoS on Amazon?
For more established, mature brands, a target ACoS of between 15% and 35% is healthy, but it can be significantly higher for high-margin products and launch campaigns. As such, a good ACoS on Amazon depends on your profit margins, growth goals, and lifecycle stage. That said, 7-figure sellers typically evaluate ACoS alongside TACoS, market share, and organic rank rather than treating it as a standalone KPI.
- What is TACoS and why does it matter more than ACoS?
TACoS (short for total advertising cost of sale) measures ad spend against total revenue (i.e. organic sales and paid sales). It’s important because it’s a more honest metric as it reflects how well advertising is growing your entire revenue base and if ads are strengthening your overall brand performance. By contrast, as ACoS only captures paid sales it measures only direct attributed ad efficiency.
- What is the 1-1-1-1 Scaling Method?
The 1-1-1-1 Scaling Method is Olifant Digital's proprietary Amazon PPC strategy that uses one campaign, one ad group, one keyword, and one ASIN. This way, each combination acts as an isolated unit to create clean attribution data and precise bid control.
- How long does it take to see results from Amazon PPC?
Most brands see results within two to six weeks. However, meaningful results (e.g., improved ACoS, organic rank boost, and revenue growth) usually only appear between 60 and 90 days, even more so if you’re operating in a competitive category. Also, keep in mind that the first two weeks establish the baseline data and from the third week you’ll be able to get a better idea of what’s actually converting and wasting ad spend.
- How do I lower my Amazon ACoS?
Amazon brands can lower their ACoS by using negative keyword refinement, tightening your match types and search terms, and improving your listing conversion rate. While bid adjustments can help, it only accounts for a fraction. As such, the most meaningful and sustainable ACoS improvements come from a multi-dimensional strategy that looks at conversion rate, average order value, and ad spend.
- What changed with Amazon Sponsored Products prompts in March 2026?
After exiting beta, Amazon Sponsored Products products became available to the US. Now, you’ll be charged for prompt clicks.
- Should I optimize Amazon PPC daily or weekly?
Daily optimization is the standard for 7-figure brands wanting to improve their margins at scale. This is because weekly optimization is too slow to catch wasted spend, underperforming keywords, and bid opportunities. That said, for the best results daily optimization should use a structured process that’s based on strategic decisions regarding campaign architecture and budget reallocation.
- How is Olifant Digital's Amazon PPC service structured?
Olifant Digital’s PPC service starts with an account audit, after which you’ll receive a custom marketing plan. Then, the team will tackle campaign architecture, optimize accounts daily with precise bid adjustments, and study reports to create new campaigns. We’ll also run continuous testing based on controlled experiments we’ve done internally with our own brand.
If you're managing Amazon PPC in-house or with an agency that optimizes weekly and doesn't track TACoS, book a free audit with Olifant Digital. We'll review your account structure, identify where ad spend is leaking, and show you exactly what senior-led daily optimization looks like — no obligation.
Get Your Free Amazon Marketing Plan

Alex founded Olifant Digital and runs a 7-figure brand alongside it. That operator background shapes how the agency operates as he tests everything with his own money. He's obsessed with staying ahead of what actually works, from PPC methodology to creative and conversion rate, and oversees all client accounts to make sure Olifant Digital delivers on its promises to scale brands profitably.


Mike leads Olifant Digital's Amazon department, setting the marketing strategy across client accounts and personally auditing PPC to make sure the team is maximising revenue and profit at every stage of growth. With 8 years of daily Amazon operations across 7 and 8-figure brands including Beauty by Earth, Ekster, COCOSOLIS and many more, he brings the kind of hands-on strategic and executional depth that most agency directors delegate away.

.svg)


.svg)
