.png)

.svg)
Introduction
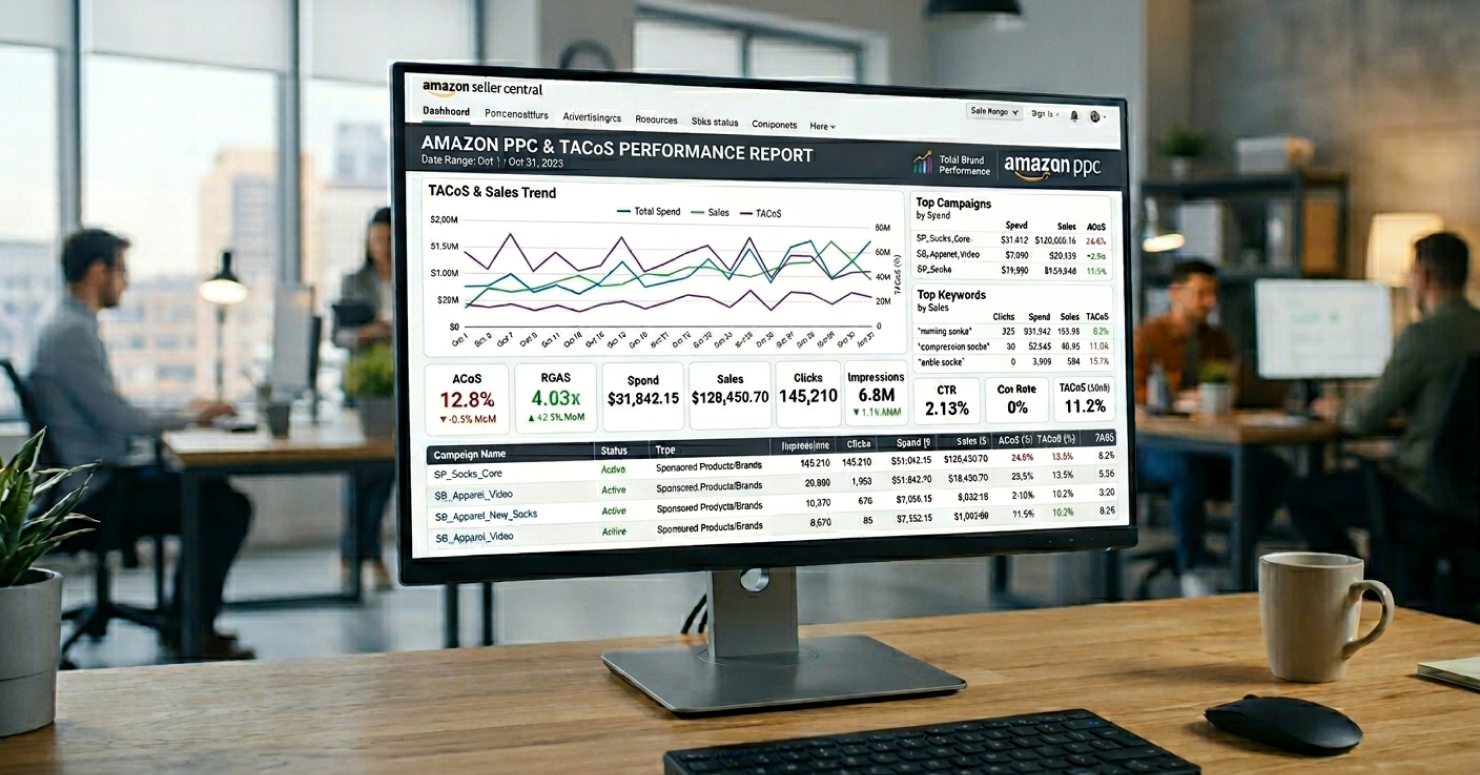
Most Amazon PPC reports are built around metrics that are easy to generate. This includes ACoS, total spend, and ROAS. While these numbers are simple to pull and present, at 7-8 figures, they are not enough.
The difference between a report that is built to look good and one that is built to inform decisions will show up in your margins, so here is the standard your Amazon PPC reporting should meet and what it costs when it doesn’t.
Short Answer
Most Amazon PPC reports are built to look good, not to help you make decisions. ACoS, total spend, and ROAS are very easy to put together and to be presented. However, the real problem is they don't tell you enough about your account once you start making 7-8 figures.
At this revenue level, the account-level metrics smooth over the important details such as ASINs that erode the margin, the organic rankings that slip, and the new-to-brand customer share that determines whether there is sustainable growth.
Meaningful reports are those that cover all the details about how the account actually moves.
This includes TACoS and CVR by ASIN, new-to-brand percentage, organic ranking trends, search term data, impression share, campaign-type breakdowns, and the split between organic vs. paid revenue.
The difference between operating with this data and not doing so will show up in your margins.
Why Aggregate Metrics Are Not Enough at 7 - 8 Figures
When your account has more than 100+ ASINs, ACoS might look healthy while in the background you have running individual ASINs that have spend ratios that make no sense.
The account average does a lot of hiding. While one ASIN cluster that runs at 40% while the account average sits at 18% stays completely hidden in a blended report, in reality, this cluster is burning your money in the background regardless of what the overall number shows.
ROAS has a similar issue. If your brand has a strong organic presence, the branded keywords will always convert well, and it will push ROAS up. However, this doesn’t always mean that you are attracting new customers.
If your ad-attributed revenue comes from people that are already going to search your brand anyway, that ROAS number is not telling you very much.
The total ad spend and total revenue give you a summary, but not an explanation. While they tell you the outcome, they don’t specifically provide which ASINs drove it, what caused it, or whether or not it will hold the next month. At 7-8 figures, you need reporting that points forward and not just reporting that confirms the past.
A good report should tell you where to put more budget, where to pull back, and which products are ready to scale and whether your paid-to-organic balance moves in the right direction.
Every metric that is present in the weekly report should connect to a decision someone on your team is going to make that week.
The 8 Metrics Every 7- 8 Figure Amazon PPC Report Must Include
The following 8 metrics are the ones we use to build reports for our clients. Each one answers a specific question that a 7-8 figure brand needs answered every week. Each one also surfaces a problem that aggregate reporting misses.
1. TACoS by ASIN - not just account-level
TACoS (Total Advertising Cost of Sales) measures the ad spend as a percentage of total Amazon revenue and includes organic sales, which were not ad-attributed.
ACoS, on the other hand, only measures the ad spend against revenue that came directly from ad clicks. At an account level, TACoS provides a clearer profitability picture because it captures the organic halo that mature brands generate.
At 7-8 figures with a large catalog, the account-level TACoS will still average the winners and losers. What actually drives the budget decisions is TACoS at the ASIN level - which is knowing which products are relying on ad spend and those that get organic revenue on their own.
These are two different situations that a single account-level number will not show you.
For Beauty by Earth we do TACoS reporting across all 100+ ASINs every week. This is the breakdown that allows the team to move towards what is working and stay away from what isn't before an underperforming ASIN becomes a bigger problem.
2. New-to-Brand Customer Percentage
New-to-brand percentage (NTB%) tracks how many of your ad-attributed purchases come from customers that haven’t bought from you in the last 12 months.
Amazon makes this available in Sponsored Brands and Sponsored Display reporting. The reason why this is important is that a brand can show solid revenue growth while NTB% is quietly dropping, which means that growth is coming from repetitive buyers and not from new people who have just discovered the brand.
You can track the NTB% by campaign type for at least 90 days, and if you see its levels dropping while ROAS holds steady, this is a clear sign that the account is being maintained rather than grown.
3. Organic Ranking Velocity for Target Keywords
For primary keywords, organic ranking positions should be tracked and reported weekly. This is different from paid visibility, as it tells you whether the combined effect of listing SEO and PPC-driven activity is actually where your products show up in organic search over time.
At 7-8 figures, how much revenue comes from your organic vs. paid traffic affects your profitability. The stronger your organic ranks are, the less you have to spend to generate each sale.
When we shifted Onsen Secret's reporting from ACoS-only to TACoS, our team could see for the first time whether the paid spend was actually pushing their products up in organic search. That visibility is what shaped every scaling decision going forward.
4. Conversion Rate (CVR) by ASIN - trended
Tracking CVR at the ASIN level on a weekly basis gives you an early warning before any problems show up in revenue.
When CVR starts to slip on an ASIN that has been stable, it means that something has changed. This could mean that a competitor has improved their listing, your price may have moved out of range, or your review score took a hit. CVR is what catches this shift before anything else does.
CVR is also connected directly to organic ranking, and Amazon favors listings that convert well. When CVR drops, it doesn't just affect the immediate sales, but it can pull your organic position too.
Setting a threshold for each ASIN and flagging anything that moves outside it means you're catching problems early, not after the damage is already visible in your revenue numbers.
By the time your CVR appears as a revenue drop, you have already lost ground that you didn’t need to lose.
5. Search Term Harvest Report - Weekly
The search term report's purpose is to tell you exactly what customers searched for when your ads came up.
When you have 7-8 figures, the data is too valuable to be reviewed less than weekly because it shows you which keywords are worth targeting and which ones are burning your budget without making any conversion and whether the competitor's brand terms are triggering your ads.
When you don't have this report on a weekly basis, you are leaving the easy wins on the table for competitors to grab them.
6. Impression Share and Lost Impression Share
Impression share tells you what percentage of available ad visibility your campaigns are capturing for your target keywords.
Lost impression share is what breaks that down into two causes: either your bids are not competitive enough or your campaigns are running out of budget before the day ends.
When you are making 7-8 figures, it's important to know which one it is. Because a drop in traffic can mean that a competitor is outbidding you, or it could mean a budget cap which you could solve by raising it today.
Without having an impression share broken down by rank and budget, you can’t tell the difference, and you can’t act on it.
7. Ad Spend Efficiency by Campaign Type
Sponsored Products, Sponsored Brands, and Sponsored Display all have a different function.
Sponsored Products capture shoppers that are ready to buy. Sponsored Brands build awareness and reach those customers that are browsing multiple products at once. Sponsored Display brings back those shoppers that have shown interest but didn't buy.
At 7-8 figures, it's important to get a separate performance report, because if you have a blended ACoS for all three, you can't see which part of the budget is working and which one isn't.
8. Organic vs Paid Revenue Split - Trended
The organic vs. paid revenue split is what tells you if your account is building momentum or is just buying its way to the same results repeatedly month after month.
If your organic revenue is growing as a share of the total, this means your SEO and listings are doing more independent work. However, if your paid revenue keeps climbing, it means you're spending more to hold the same ground.
Getting a monthly split report alongside TACoS will give you a complete picture of the account's long-term health. It's one of the most important metrics for accounts with 7-8 figures, and it's one of the most common that get left out.
By the time brands notice the imbalance, it has already affected their margins.
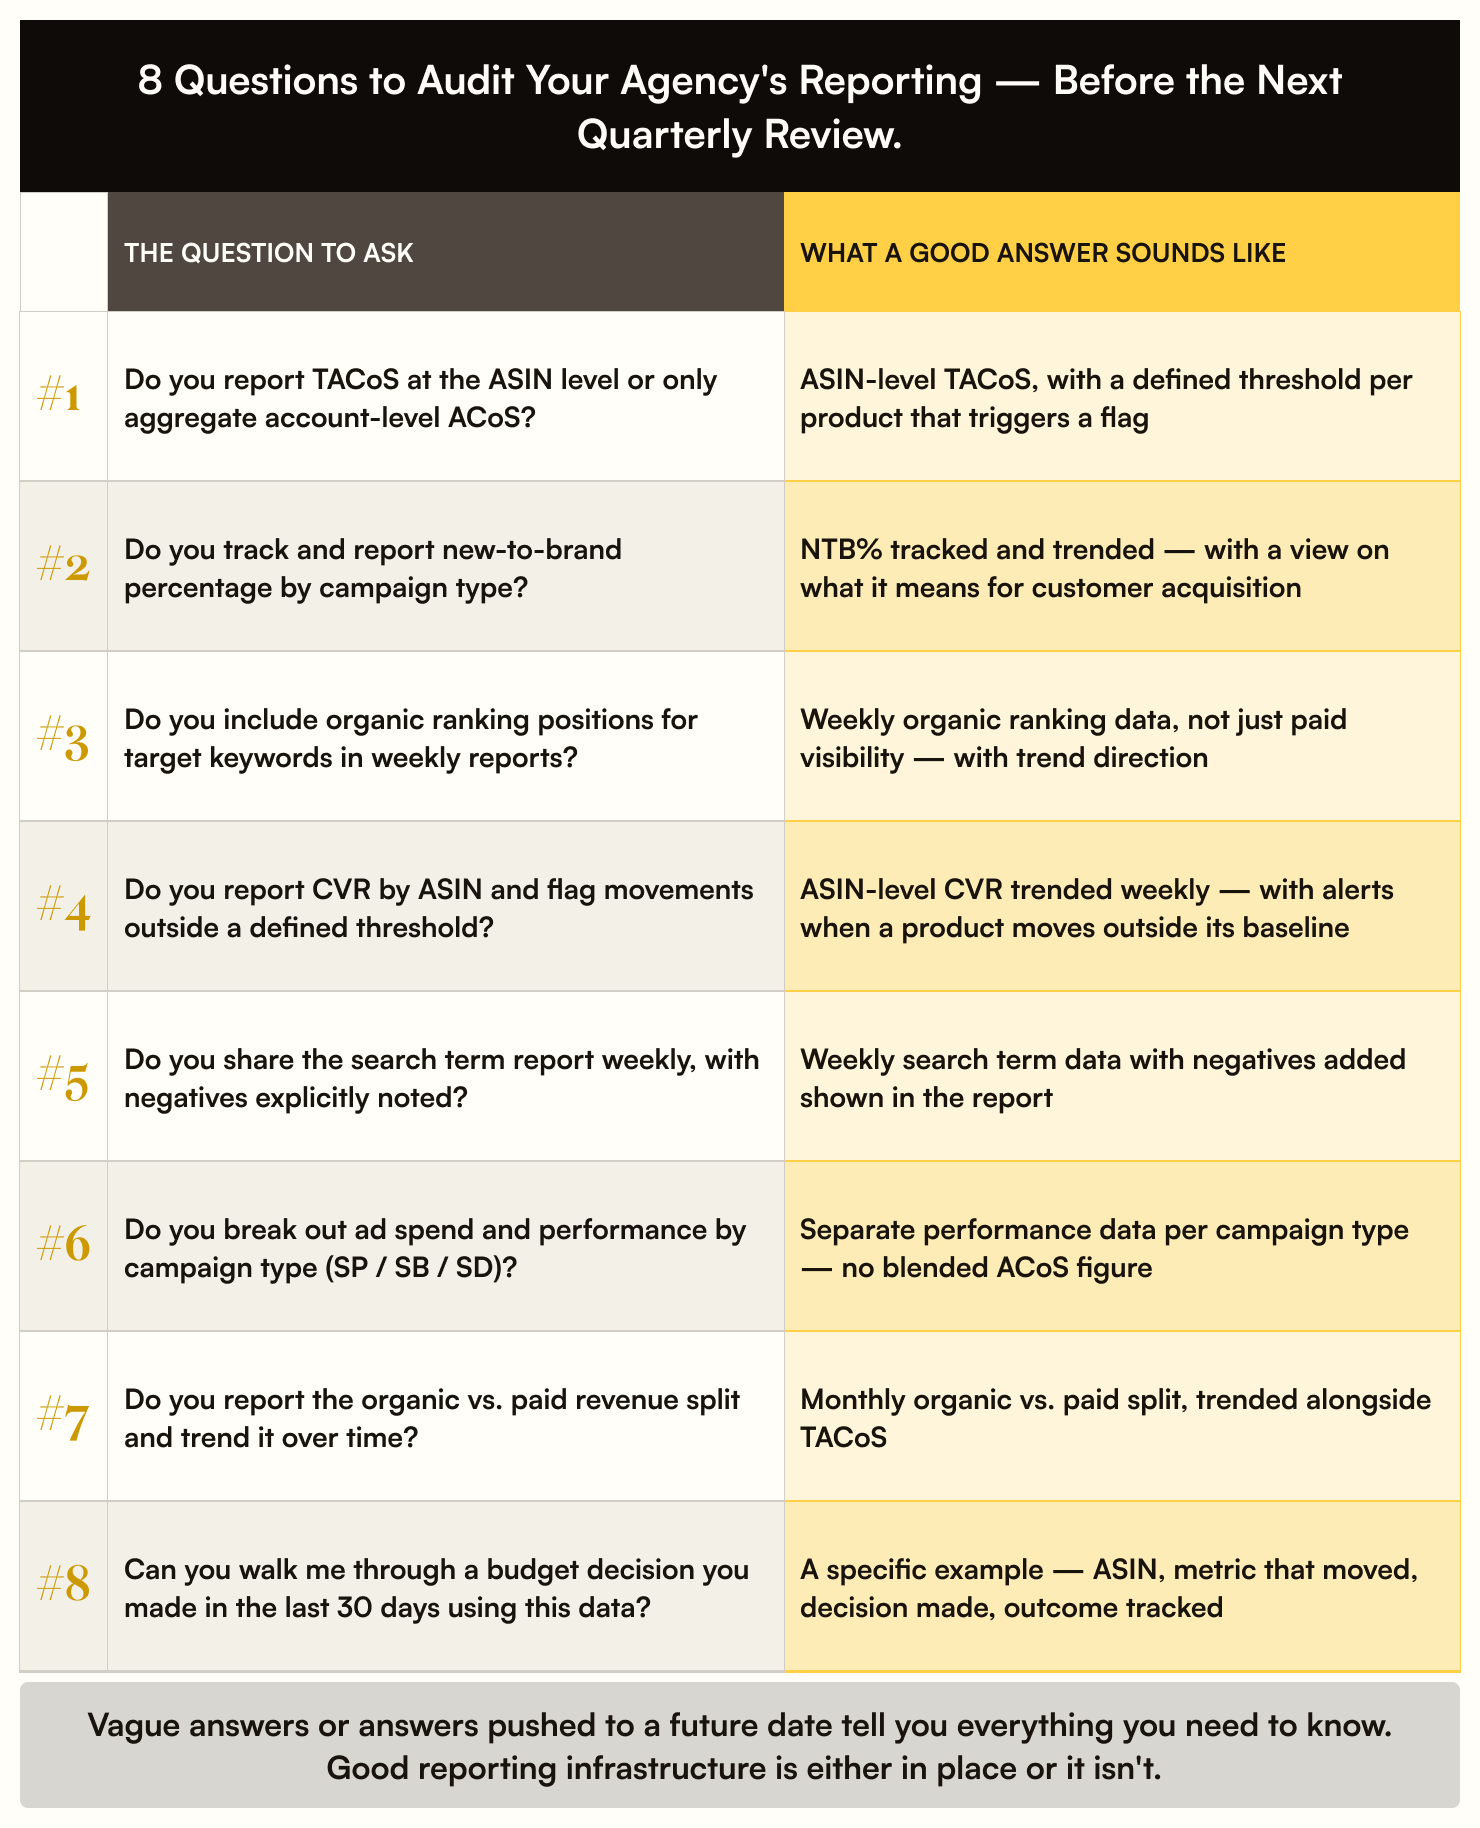
The Red Flags - What a 7–8 Figure Brand Should Never Accept in a PPC Report
Use the table below as a quick check on your current reports.
The left column shows what you should be seeing every week. The right column shows the gaps that tell you the reporting wasn't built for the scale you're operating at.
If most of your answers are coming from the right column, it means the agency is not meeting the standards.
What This Looks Like in Practice - How We Report for Our Clients
For Beauty by Earth, which is an 8-figure brand with over 100 ASINs, we deliver weekly TACoS reporting at the ASIN level. This gives each product its own visibility line in the weekly report.
Since all the budget decisions are made from ASIN-level data, if any product's TACoS moves outside its target threshold, it immediately gets flagged and doesn't wait until the next monthly review.
As a result of having the right reporting infrastructure, where we could see where the ad spend was efficient and where it was wasting margin, they experienced a 27% revenue increase in the first 30 days.
For Onsen Secret, the problem was the invisible ACoS reporting. The growth attempts repeatedly eroded the profitability because the account was optimized against the wrong metric.
Once we switched to TACoS reporting with organic ranking tracking alongside it, the picture became clear - the ad spend was not building organic position proportionally.
When we restructured the ad spend around proven high-converters, optimized listings before scaling ads, and tracked organic ranking velocity weekly, they experienced $95,934 added in monthly Amazon revenue with tripled profit, not just tripled spend.
What both of these examples have in common is that the reporting was built to drive decisions, not just document results.
Our clients know every week which ASINs to scale, which to cut, and whether their organic rankings are moving in the right direction, and what their NTB trend says about the health of their customer base.
This is the exact way every reporting should look for brands with 7-8 figures, as these brands need a clear view of what to do next.
Questions to Ask Your Agency About Their Reporting
If you are evaluating your current reporting setup, or considering working with a different agency, these are the questions worth asking. The answers will tell you quickly whether your reporting is built for the scale you are operating at.
- Do you report TACoS at the ASIN level or only aggregate account-level ACOS?
- Do you track and report new-to-brand percentage by campaign type?
- Do you include organic ranking positions for target keywords in your weekly reports?
- Do you report CVR by ASIN and flag movements outside a defined threshold?
- Do you share the search term report weekly, with negatives added shown explicitly?
- Do you break out ad spend and performance by campaign type (Sponsored Products, Brands, and Display)?
- Do you report the organic versus paid revenue split and trend it over time?
- How do you use reporting to make budget allocation decisions? Can you walk me through a specific example from the last 30 days?
If the answers they provide are vague, or they keep getting pushed for a future date, this tells you all you need to know about the agency and their type of work. Good reporting infrastructure is either in place or it’s not, and there is no in-between at this revenue level.
Frequently Asked Questions
What metrics should be in an Amazon PPC report for a 7–8-figure brand?
The non-negotiable metrics at this scale are TACoS by ASIN (not just account-level ACoS), new-to-brand customer percentage (which is trended by campaign type), organic ranking positions, CVR by ASIN, search term data with negatives, impression share by rank and budget, ad spend, which is broken down by campaign type, and the organic vs. paid revenue split.
If your report is missing most of these, it simply means that it was not built for the revenue level that you’re operating at.
What is TACoS and why does it matter more than ACOS in Amazon PPC reporting?
TACoS is a metric that measures the ad spend as a percentage of your total Amazon revenue, with organic sales included, not just those that came from ad clicks.
That’s a very important difference from ACoS, which only counts revenue that is tied directly to an ad.
At scale, this is a blind spot that adds up. As the organic revenue grows, ACoS naturally drops, and this can make it look like your ads are underperforming when they are actually building long-term ranking.
When we shifted Onsen Secret to TACoS as a primary metric, the brand tripled its profit - not because anything changed in the campaigns immediately, but because the reporting finally showed where the spend was and wasn’t working.
What is new-to-brand percentage and why should 7–8 figure brands track it?
New-to-brand percentage measures the share of ad-attributed orders from customers that haven’t ordered from the brand in the past 12 months. NTB% is available in Amazon’s reporting for Sponsored Brands and Sponsored Display campaigns.
For brands with 7-8 figures, NTB% is the indicator of sustainable growth. A brand that has a declining NTB% is growing by reselling to its existing customers and not by acquiring new ones.
An agency that leans too heavily on branded Sponsored Products will often have this pattern, because branded terms convert well but mostly reach customers that were already looking for you. You can track NTB% by campaign type and give it 90 days so you can see the real trend.
How often should Amazon PPC reports be delivered at 7–8 figure scale?
Amazon PPC reports should be delivered at least weekly for this revenue level. Waiting for a monthly report means a full month of budget, which can be allocated in the wrong direction before someone catches it.
The weekly report should cover the things that move week to week. This includes ASIN-level TACoS, CVR changes, search term harvests with negatives, and organic ranking updates for target keywords.
Then, once a month this weekly data gets pulled together so it can be seen how the organic vs. paid split is shifting, where NTB% is heading, and what budget decisions make sense for the upcoming month.
What does 'organic vs. paid revenue split' mean in Amazon PPC reporting, and why does it matter?
The organic vs. paid revenue split tells you exactly what percentage of your Amazon revenue comes from organic listings and what percentage comes from ads.
While it might sound simple, it's one of the most telling numbers in the account, as every paid sale has an ad spend behind it, whereas organic sales don't.
A brand that has a growing paid share over time ends up spending more just to hold its position. This becomes a warning sign when the overall revenue looks healthy because the cost of maintaining that revenue is quietly increasing.
When you track this split every month, alongside TACoS, you will get a clear image of whether your account is becoming more efficient or you are just buying the same results at a higher cost.
For Onsen Secret, as organic rankings improved, the organic share of revenue grew, TACoS fell, and profit tripled.
If your current reports don't include ASIN-level TACoS, new-to-brand percentage, and organic-ranking data, you're making budget decisions without the full picture, and at 7–8 figures, that gap has a real cost.
A free marketing plan with Olifant Digital is a straightforward next step. We'll look at your current reporting setup, identify what's missing, and show you exactly what your account looks like with the right metrics in place. No pitch - just a clear view of where you stand.

Alex founded Olifant Digital and runs a 7-figure brand alongside it. That operator background shapes how the agency operates as he tests everything with his own money. He's obsessed with staying ahead of what actually works, from PPC methodology to creative and conversion rate, and oversees all client accounts to make sure Olifant Digital delivers on its promises to scale brands profitably.


Mike leads Olifant Digital's Amazon department, setting the marketing strategy across client accounts and personally auditing PPC to make sure the team is maximising revenue and profit at every stage of growth. With 8 years of daily Amazon operations across 7 and 8-figure brands including Beauty by Earth, Ekster, COCOSOLIS and many more, he brings the kind of hands-on strategic and executional depth that most agency directors delegate away.

.svg)