


.png)
.svg)


Introduction
A product can get hundreds of clicks and still barely sell. That’s the gap most sellers miss. Conversion isn’t about traffic; it’s about what happens after the click. If you don’t measure it properly, every decision you make is guesswork.
This is where knowing how to calculate Amazon conversion rate becomes critical, because one small shift here can change how your entire listing performs.
Amazon Conversion Rate Calculation: How To Find, Measure, and Read It Correctly
Amazon doesn't have a column called "conversion rate" anywhere in Seller Central. Most sellers don't realize this until they've spent weeks tracking the wrong number, making bid changes, and listing tweaks based on data that was never accurate to begin with.
The metric you want exists, it just goes by a different name, lives in a specific report, and requires a precise formula to calculate correctly.
Here's how to find it, run the numbers, and understand what you're actually looking at.
Step 1: Understand What Amazon Actually Calls This Metric
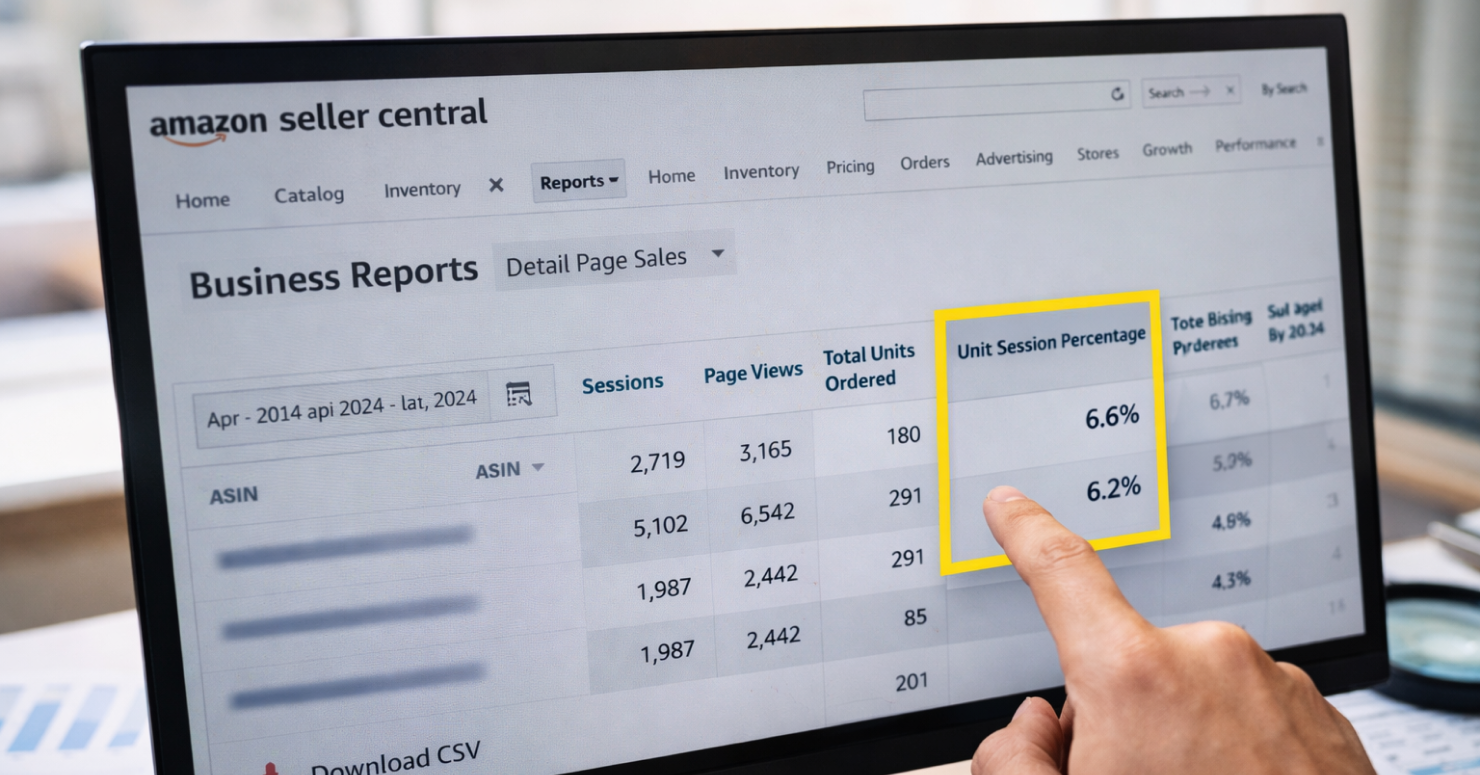
Go into Seller Central right now and look for a column called "conversion rate." You won't find one. Amazon calls it Unit Session Percentage, a different name, same concept. That's the column you want, and it's the only one that gives you an accurate read on how your listing is actually converting traffic.
It lives here: Reports → Business Reports → Detail Page Sales and Traffic (By ASIN)
- Column name: Unit Session Percentage
- Available at both the parent ASIN and the child ASIN level
If you're selling variations, pull at the child ASIN level, not the parent. A blended parent average is almost useless for diagnosis; one slow variant sits quietly inside it, and the overall number never raises a flag.
The Amazon conversion rate guide goes deeper on sessions, page views, and Business Reports navigation if you need it.
Step 2: Know the Formula Before You Pull Any Numbers
Two variables. That's the whole thing.
Unit Session Percentage = (Total Units Ordered ÷ Total Sessions) × 100
Before you pull any numbers, get clear on what each one actually means:
- Sessions: a single visitor's activity on your listing across a 24-hour window. Hit your page three times on a Tuesday? Still one session. Doesn't matter how many pages load; all activity within that 24-hour window counts as one session.
- Total Units Ordered: units bought, not transactions completed. Customer checks out with two units in the cart? That's two units ordered, one order. Formula runs on units.
The denominator is where sellers go wrong. Page views look like a reasonable stand-in for sessions; they're not. One session produces multiple page views pretty routinely, so swapping them in makes the rate look better than it really is. Problems hide.
You optimize against clean-looking data that isn't actually clean. By the time you realize the number was off, you've made several bad calls on top of it.
Important: Page views always run higher than sessions. That gap is why the two feel similar but produce completely different rates. Wrong denominator, wrong number, wrong decisions.
Step 3: Find the Numbers Inside Seller Central
Five clicks. Under two minutes. Here's the exact path:
- Log in to Seller Central
- Hover over Reports → select Business Reports
- Under "By ASIN," click Detail Page Sales and Traffic
- Set your date range; 30 days is the standard working baseline
- Scroll right to find the Unit Session Percentage column, sitting alongside Sessions, Page Views, and Total Units Ordered
Pro tip: Download as a CSV if you're across multiple ASINs. Sort by Unit Session Percentage, lowest to highest; problem listings sit right at the top.
Amazon listing optimization covers what to do with them once you know which ones need work, including how parent and child data get read separately.
Step 4: Apply the Formula With Real Examples
800 sessions in both. Completely different story each time. Walk through the numbers.
Example A - Healthy rate:
- 800 sessions over 30 days, 96 units sold
- 96 ÷ 800 × 100 = 12% Unit Session Percentage
- Solid for most categories. The listing is doing its job.
Example B - Low rate:
- 800 sessions over 30 days, 40 units sold
- 40 ÷ 800 × 100 = 5% Unit Session Percentage
- Something's broken. Weak images, pricing, poor reviews, or sessions coming from traffic that was never going to buy. Throwing more ad spend at a 5% rate doesn't fix it; it just burns faster. Working on Amazon A+ content directly closes the image and content gaps behind a rate sitting that low.
Traffic is the same. What changes is the listing. Spend more on ads with a 5% rate, and you're not fixing anything; you're funding a leak.
Check your amazon acos before you touch the budget. If spending is already unprofitable at the current conversion rate, adding more of it doesn't change the math.
Note: Unit Session Percentage can exceed 100% when a single buyer orders multiple units in one session. The formula counts units, not orders, so a number above 100% isn't a data error. It's the math working exactly as it should.
Step 5: Calculate Your PPC Conversion Rate Separately
Different metric. Different formula. Different place in Seller Central. Don't treat them as the same number.
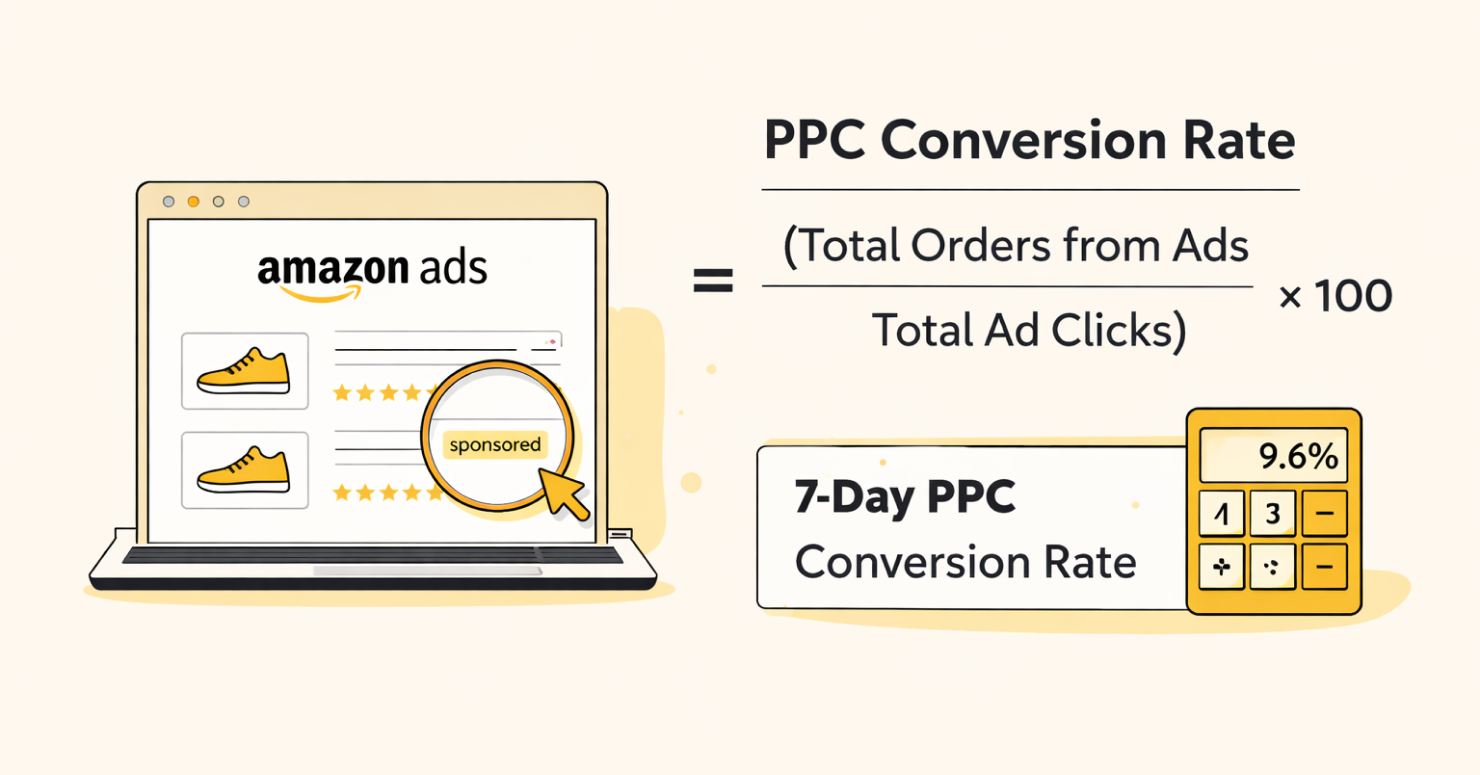
Amazon Ads Conversion Rate = (Total Orders from Ads ÷ Total Ad Clicks) × 100
- Where to find it: Go to Reports → Advertising Reports, pull a Sponsored Products report; the 7-day conversion rate is listed per keyword and per search term inside that file. Amazon does not surface conversion rate cleanly at the campaign or ad group level in Campaign Manager, so the downloadable report is the right place to look.
- What it measures: Paid click to order efficiency. Not overall listing performance, not organic; just what your ad traffic does after it clicks. Narrower than Unit Session Percentage on purpose.
- Why it matters separately: High PPC conversion rate, low Unit Session Percentage? Your ad targeting is clean, but something on the listing is losing people once they arrive. Reverse that, and it's a different diagnosis. Low CVR at keyword level in Advertising Reports? Usually irrelevant traffic. Amazon negative keywords are the fastest way to cut search terms that are spending without any real chance of converting.
Run the Amazon ACoS calculator and TACoS calculator to see whether ad spend is actually profitable against total revenue, not just what's attributed directly to the campaign. Numbers look fine on ACoS, but suspect on TACoS? That's where the real story is.
Unit Session Percentage = listing health. PPC conversion rate = campaign efficiency. Track both. Don't average them together.
Once you've got the numbers, the actual work starts: figuring out what they're telling you and fixing it.
Amazon CVR Tracking: The Weekly System Every Multi-ASIN Seller Needs
Calculating your rate once is useful. Doing it once and moving on is where most sellers stop. That's the problem. A number you checked three months ago tells you nothing about what's happening with your listing today, and decisions made on stale CVR data tend to be expensive ones.
How Often Should You Actually Pull It?
Weekly for active ASINs. Bi-weekly at the absolute minimum. And always at the child ASIN level, not the parent. A parent average buries problems. One variant converting at 3% inside a catalog averaging 11% never gets flagged if you're only reading the rolled-up number.
By the time the drag shows up in revenue, it's been bleeding for months.
Which Date Range to Use and When
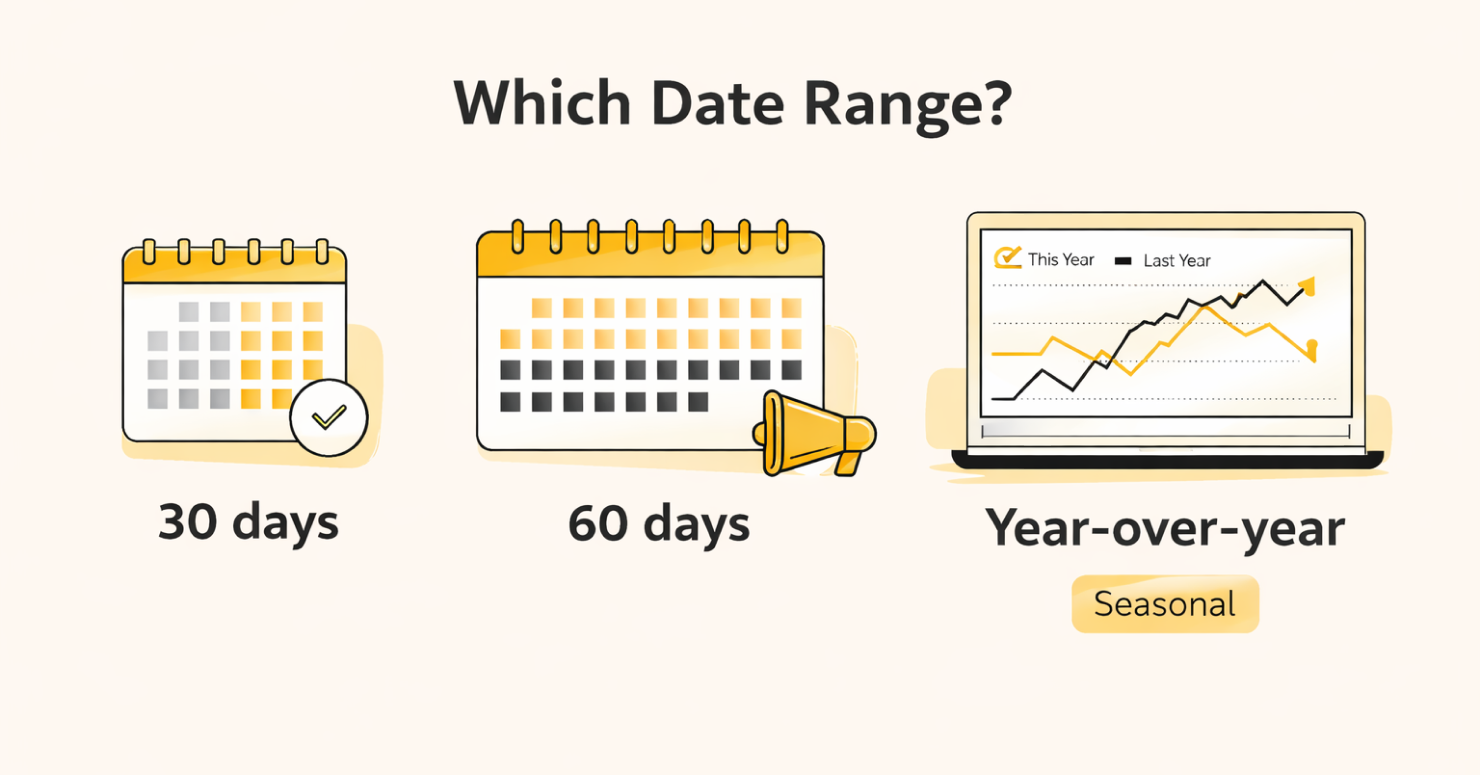
30 days is your working baseline. Recent enough to reflect what's actually happening now, enough volume to be meaningful. Use it by default.
60 days when you've run a promotion, Amazon coupons, or any traffic event. A single week of inflated sessions can make the rate look worse than it is. Zoom out, read the trend, not the spike.
Year-over-year for seasonal products only. A CVR drop in November looks alarming until you check that November last year was identical. Seasonal categories have natural dips and peaks; comparing to a rolling 30-day window during those periods produces false signals.
Three Things That Should Trigger an Immediate Pull
Don't wait for your weekly review in these situations. Pull the report the same day:
- Unit Session Percentage drops sharply with no clear external cause
- Sessions climb, but sales don't follow, meaning traffic is arriving and leaving without buying
- You made any change to the listing, whether it's a new product photo swap, a price move, or a title edit
That third one is the habit most sellers skip. Every listing change you make is a test. If you don't note when you made it and compare CVR before and after, you'll never know whether it helped, hurt, or did nothing at all.
How To Use CVR as a Before/After Test
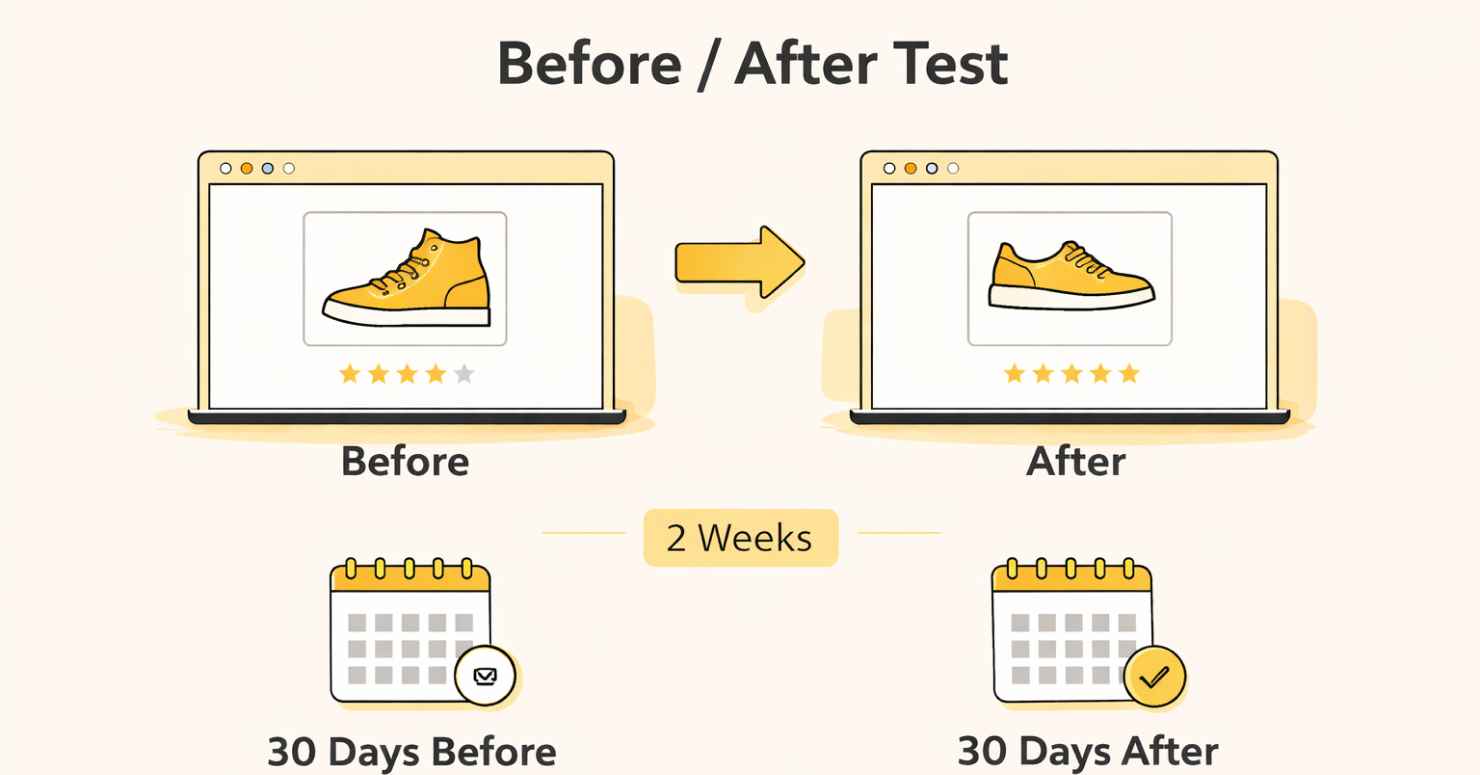
One change at a time. Two weeks minimum between changes. Then pull the same date range before and after.
Swap your main image on the 1st. Pull the 30-day report on the 1st of the following month and compare it to the 30 days before the change.
CVR improved? The image is working harder.
Dropped? You know exactly what caused it.
Run two changes at once, and you can't attribute anything. The data becomes noise.
This is the only reliable way to know whether an image swap, a price test, or an Amazon product description rewrite actually moved the needle.
The Weekly Routine for Multi-ASIN Sellers
Doing this manually across a large catalog takes too long if there's no system behind it. Here's one that works:
- Download the Detail Page Sales and Traffic report as a CSV
- Sort by Unit Session Percentage, lowest to highest
- Flag the bottom 20% as your triage list for that week
- Direct all optimization attention there first
The bottom 20% is where the most recoverable revenue sits. Listings already converting well don't need your time this week. The ones quietly converting at 4% while burning sessions do. Treat the sort as a work order, not just a report.
If the catalog is large enough that even this takes hours, an Amazon account management agency runs this triage on your behalf every week, so nothing slips through unnoticed.
Stop Tracking Noise And Start Fixing What Impacts Sales
Get the number right first. Everything else depends on it. A clean conversion rate shows you one thing clearly: is your listing converting or leaking sales? From there, it’s about discipline. Check it regularly, spot the drop, and fix the cause, not the symptom. Don’t guess. Test one change, wait, then compare.
Most sellers chase traffic too early and pay for it later.
If you want this handled properly, we do it every day at Olifant Digital. We break down your CVR by listing and keyword, fix weak points, and help you scale without wasting spend.

Alex is the founder and CEO of Olifant Digital, where his team manages over $100M in annual Amazon client revenue across 50+ brands, and he runs a 7-figure Amazon brand of his own. That operator background shapes how the agency works: every tactic is tested with his own money before it reaches a client account. He oversees PPC methodology, creative, and conversion rate across all client accounts to make sure Olifant Digital scales brands profitably.


Mike reviews every Amazon article on this blog for strategic and technical accuracy before it publishes. As Director of Amazon Growth at Olifant Digital, he sets marketing strategy across client accounts and personally audits PPC at every stage of growth. He brings 8 years of daily Amazon operations across 7 and 8-figure brands including Beauty by Earth, Ekster, and Bullstrap, the kind of hands-on depth most agency directors delegate away.

.svg)


.svg)
