


.png)
.svg)


Introduction
Amazon shoppers don’t search cleanly. They type oddly specific, sometimes messy phrases that still convert, “quiet blender for early mornings” or “gift under $20 for coworkers.” That’s where real buying intent shows up.
Analyzing an Amazon Search Term report turns those raw queries into clear signals, showing exactly which searches drive revenue and which ones quietly drain your budget.
Amazon Search Term Report: A Practical Breakdown For Smarter PPC Decisions
The Search Term Report has more usable data in it than most sellers ever pull out of it. Real buyer queries, spend broken down by term, conversion signals, and ASIN placements from competitor pages. It's all there.
Most people open it, get overwhelmed, and start clicking whatever looks interesting. That's not a process. Below is the exact sequence to work through it properly, one step at a time.
Step 1: Download The Report Correctly
In Seller Central, go to Reports → Advertising Reports. Hit Create Report. Select Sponsored Products or Sponsored Brands as the campaign type. Choose Search Term as the report type. Set the date range. Click Run Report, then download the CSV.
- 30 days is the working baseline, enough orders to see real patterns
- The lookback window maxes out at 65 days, download monthly, or that data is gone permanently
- Sponsored Products and Sponsored Brands need separate pulls; the columns, attribution windows, and maximum queryable date ranges differ between them
Seven days of data isn't analysis. On a low-volume campaign, that's maybe three clicks and one sale that might not even be attributed yet. Thirty days is the floor before anything you see is worth acting on.
Step 2: Set Up Your Spreadsheet Before Touching The Data

Open the CSV in Excel or Google Sheets. Freeze the header row so labels stay put as you scroll. Enable filters on every column. Takes two minutes. Skipping it costs more time later when you're deep in the sheet and losing your place.
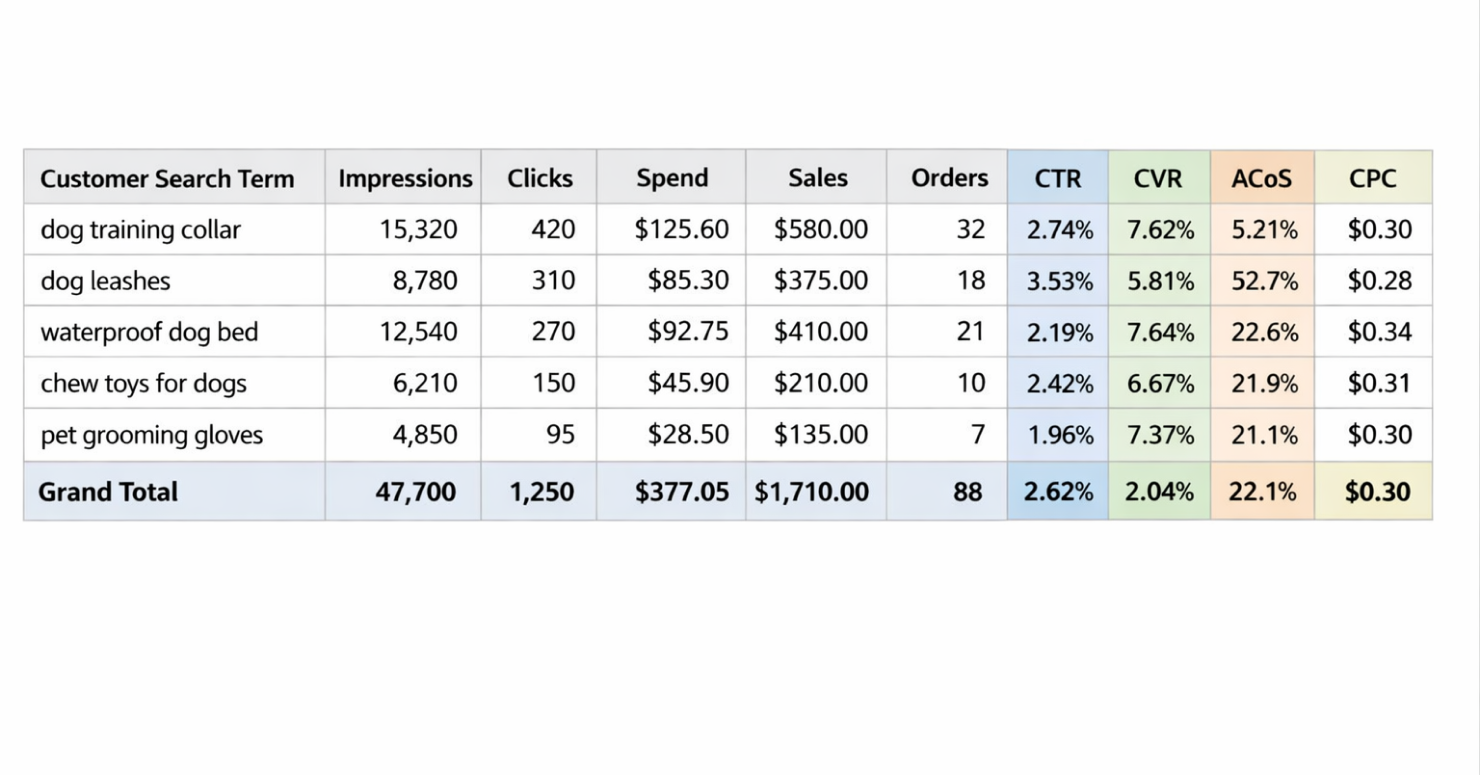
The raw CSV does include columns for ACoS, CVR, CTR, and CPC. The issue comes in Step 3. When you paste the pivot table as Values Only into a new sheet, all formulas are removed because you're transferring static numbers, not live calculations.
That's why you need to re-add these four formulas manually to the clean sheet. The formulas:
- CTR = Clicks ÷ Impressions (percentage)
- CVR (conversion rate) = Orders ÷ Clicks (percentage)
- ACoS = Spend ÷ Sales (percentage)
- CPC = Spend ÷ Clicks (currency)
Rows showing #DIV/0! have zero clicks or zero sales in that row. Wrap those in IFERROR and replace with a zero or dash. Our Amazon ACoS Calculator and TACoS Calculator are useful alongside the sheet when cross-checking efficiency against your actual margin targets.
Step 3: Build A Pivot Table To Consolidate The Data
This is the step most sellers skip. Here's why it matters. One search term triggering across five campaigns shows up as five separate rows in the raw file, each with its own fragmented numbers. You can't read performance that way. The term looks like it's doing less than it is, or worse than it is, depending on which row you happen to look at.
A pivot table collapses it. One row per search term, totals across all campaigns combined. In the editor:
- Customer Search Term goes to Rows
- Impressions, Clicks, Spend, Sales, Orders go to Values, each set to SUM
- Add Portfolio Name to Filters if you're working across multiple product lines
Once it's built, copy the whole thing and paste as Values Only into a new sheet. The pivot itself can't be permanently sorted or filtered the way you need. The flat copy can. Re-add the CTR, CVR, ACoS, and CPC formulas to that sheet since pasting as values strips all live calculations.
Pro tip: Shade the four calculated columns a different color from the native Amazon columns. Ten seconds of formatting, and you can immediately see which numbers came from the file vs. which ones you built. Matters when you're reviewing with someone else.
Step 4: Sort By Total Sales, Highest To Lowest
Click the filter arrow on 7 Day Total Sales (the SP report column name). Sort highest to lowest. Done. The sheet now shows you what's actually working at the top and surfaces the problems as you scroll down.
- High 7 Day Total Sales at the top = Terms where your spend is producing real revenue
- High spend, near-zero sales anywhere in the list = Budget draining with nothing to show
- Zero impressions, zero spend = Terms your campaigns aren't touching at all
Top to bottom. Best terms first, problem terms visible as you go. That's the read order for every session from here.
Step 5: Identify Your Winners
Filter for terms with two or more orders. One conversion isn't a signal. It could be a gift, a misclick, a shopper who won't return. Two orders are the minimum before a term earns an action. Then add a second filter: ACoS at or below your target.
For anything that clears both:
- Raise the bid to pull more traffic from that term
- Move it from auto into a manual exact match campaign
- If it's already in the manual, increase the bid in small steps, not one big jump
Pro tip: A term sitting just above your ACoS target with a strong CVR is worth a second look before you cut it. High CVR means buyers who search that phrase are buying.
That's purchase intent. Keep it at a lower bid rather than pulling it entirely. Narrowly missing a threshold isn't the same as failing.
Step 6: Identify Your Bleeders
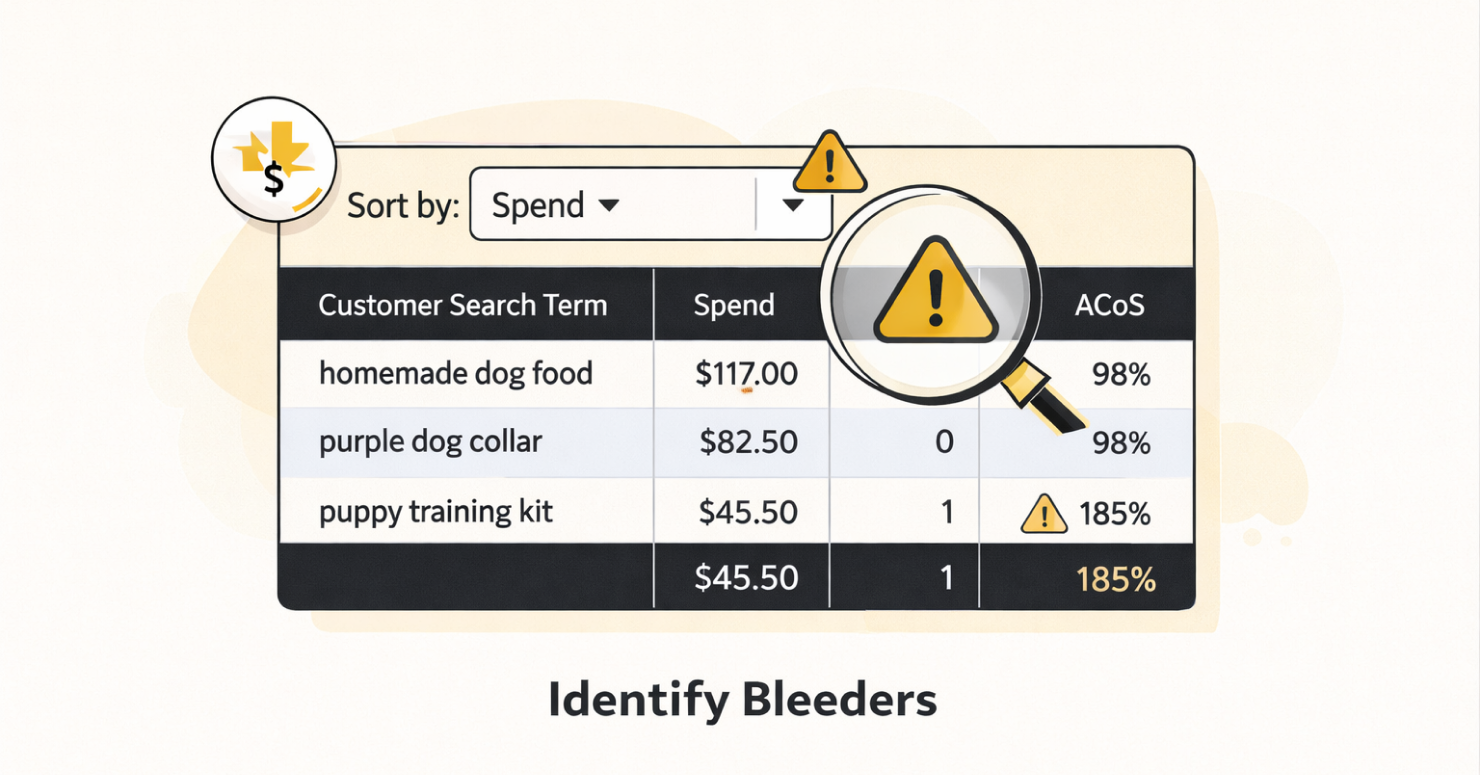
Sort by Spend, descending. Scan for terms carrying real spend with nothing in the orders column.
- High spend, zero orders: Add it as a negative keyword immediately, no further review needed
- CVR well below your account average: it's a slow bleed that accumulates quietly over weeks
- One order, very high ACoS: Flag it and check next cycle again before making a call
The easy ones sit right at the top after you sort. The expensive ones are buried in the middle. Something like $45 in spend, one order at 185% ACoS.
Looks small by itself. Twelve terms like that are $540 a month in budget, producing nothing. Work through the whole list. Stopping at the top ten misses most of the actual waste.
Step 7: Audit Your CTR Column For Relevance Signals
A CTR below 0.3% means the ad is showing up, but shoppers aren't clicking. Not a bid problem. Raising the bid on a low-CTR term just means paying more per impression while still not getting the click.
- Low CTR, high impressions: The ad appears often, but doesn't earn the click
- The disconnect is the main image, price, or title not matching what that query expects
- Bidding up doesn't fix a listing problem
Flag these terms separately. Bring them to a listing review, not a campaign adjustment. Get the image sharper, the price more competitive, the title tighter for that query, and CTR moves on its own. The fix is on the product detail page, not in Advertising Reports.
Step 8: Check For ASIN Entries In The Customer Search Term Column
Not everything in that column is a keyword phrase. Some rows show an ASIN. That's product targeting, not a keyword match. The ad appeared on a competitor's product page, and someone clicked it from there.
- Those ASINs show which competitor listings the ads are running on
- An ASIN driving consistent sales is a placement worth protecting
- Build a dedicated product targeting campaign for that ASIN and bid on it directly
Keep ASIN rows separate from keyword rows during the review. The decisions are different. Keyword rows are about match types and bids. ASIN rows are about which competitor pages to target and how much budget to put behind them.
Step 9: Review Advertised SKU Sales vs. Other SKU Sales
Two revenue columns live in this report. One covers sales from the SKU being advertised. The other covers sales from a different SKU in the catalog that the shopper bought after clicking that same ad.
- Some terms drive more Other SKU Sales than Advertised SKU Sales, consistently
- That's the market picking a different product in the catalog for that query
- This column gets skipped constantly, and it's where misallocated spend hides
A term that keeps converting to a different SKU deserves its own test. Build a separate campaign advertising that SKU directly, and run the same term inside it. The data tells you which product fits the query. Follow it.
Step 10: Document Decisions And Take Action
Before closing the file, three lists:
- Terms to harvest into manual campaigns
- Terms to negative out now
- Terms to watch next cycle, signals are there, but data isn't enough yet
Closing with a general sense of what you saw doesn't help. A written list, even rough, means the next Campaign Manager session has a clear brief behind it. The report shows what's happening. The list is what changes it.
Ten steps. One report. Every session should end with terms to scale, terms to cut, and terms to watch. That's the whole process.
Search Term Report Errors That Are Costing You Money Right Now
Most sellers don't make mistakes in the analysis itself. The errors happen before, during, and after. Six of them come up constantly.
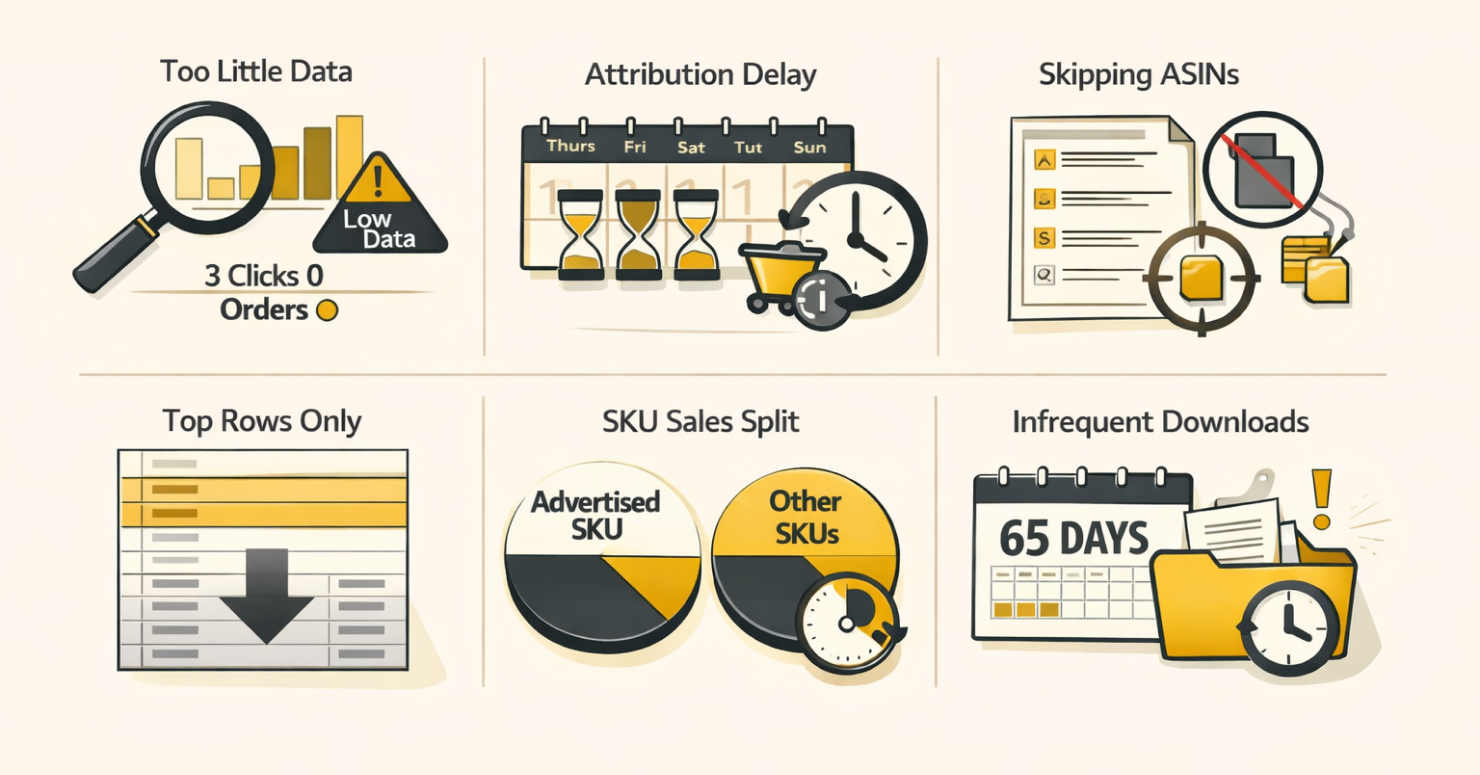
Acting On Too Little Data
Three clicks and zero orders isn't a bleeding keyword. That's just not enough data to call anything. Acting on it means you're pausing or negating terms based on noise, not performance.
What to do instead:
- Pull at least 30 days before making any bid, harvest, or negate decision
- For low-conversion-rate products, the click threshold before zero orders means anything is higher still
- Term looks suspicious but has fewer than 10 clicks? Flag it and come back next cycle
Misreading ACoS Because Of The Attribution Window
Here's what catches a lot of sellers off guard. Sponsored Products run on a 7-day attribution window in Seller Central; Sponsored Brands run on 14. A shopper who clicked on Thursday and bought on Sunday counts as a conversion, but it won't show in your data yet. Pull too early, and your ACoS reads higher than reality.
The fix is simple:
- Don't treat ACoS as final until at least a week has passed after your date range ends
- Report pulled Monday covering last week? Friday and Saturday conversions are probably still pending
- No bid cuts on data from the last 7 to 14 days of the reporting window
Skipping ASIN Entries In The Customer Search Term Column
When an ASIN shows up in that column instead of a keyword phrase, your ad appeared on a competitor's product page through product targeting, not a keyword match. These rows get skimmed past all the time, and they shouldn't be.
What to do:
- Run a separate filter for ASIN entries so they don't get buried inside keyword rows
- Consistent sales coming from an ASIN? Build a dedicated product targeting campaign around it
- Clicks but no orders from an ASIN? Treat it like any other bleeder and negative it out
Only Analyzing The Top Of The Sheet
Sorting by 7 Day Total Sales and stopping at row 20 misses most of the actual waste. It's sitting in the middle, in terms of $40 in spend, one order at 180% ACoS, and nothing alarming at first glance. Multiply that across 15 terms, and you're losing $500+ a month without knowing it.
The process fix:
- Work through the full list, not just the top rows
- After sorting by sales, run a second sort by Spend descending to surface mid-list bleeders
- Flag anything with significant spend and ACoS more than double your target, wherever it sits
Ignoring The Advertised SKU vs. Other SKU Sales Split
Most sellers never look at this column, which is a shame because it tells you something important. The report splits sales into two buckets: revenue from the SKU you're actually advertising, and revenue from a different SKU the shopper bought after clicking that same ad.
If the second number keeps beating the first, you're advertising the wrong product for that term.
What to check:
- Review this column for every high-spend term you're analyzing
- Other SKU Sales consistently beating Advertised SKU Sales on one term? Build a separate campaign around that SKU
- Don't write off a term as low-performing based on Advertised SKU Sales alone
Downloading The Report Too Infrequently
The window is 65 days. Download quarterly, and you've already lost a month of data that can't be recovered. It's gone. There's no archive, no request process, nothing.
Pull it regularly:
- Monthly download, minimum. Put it in the calendar now, not after the next time you lose data
- High-spend accounts warrant a pull every two to three weeks
- The Advertising Reports interface lets you set up recurring delivery so Amazon sends the file automatically
Get these right, and the analysis stops being a chore. It becomes the clearest window into where your ad spend is actually going.
Better Search Term Decisions Lead To Stronger Sales Velocity
Search term reports don’t improve performance on their own. The edge comes from how consistently you act on them. Clean the data, group it properly, identify winners, cut waste, and repeat the process without skipping cycles. That’s what drives better decisions and, over time, stronger sales velocity.
If you want tighter control over your campaigns and cleaner execution, work with an experienced Amazon account management team like Olifant Digital. We focus on turning search term data into structured actions that actually move revenue, not just reports that look good on paper.

Alex is the founder and CEO of Olifant Digital, where his team manages over $100M in annual Amazon client revenue across 50+ brands, and he runs a 7-figure Amazon brand of his own. That operator background shapes how the agency works: every tactic is tested with his own money before it reaches a client account. He oversees PPC methodology, creative, and conversion rate across all client accounts to make sure Olifant Digital scales brands profitably.


Mike reviews every Amazon article on this blog for strategic and technical accuracy before it publishes. As Director of Amazon Growth at Olifant Digital, he sets marketing strategy across client accounts and personally audits PPC at every stage of growth. He brings 8 years of daily Amazon operations across 7 and 8-figure brands including Beauty by Earth, Ekster, and Bullstrap, the kind of hands-on depth most agency directors delegate away.

.svg)


.svg)
